GIS Day this week!

GIS Day 2010
November 17, 2010
3:00 pm to 8:30 pm
UC Berkeley, Mulford Hall
http://gif.berkeley.edu/gisday.html

Please join us for GIS Day 2010 on Wednesday, November 17. 
The list of speakers and topics are now available on the event site, including this year’s keynote presentation from Brady Forrest!

GIS Day is free, but we encourage you to register, so that we know how many people to expect.  We still have room for posters, if you’d like to display a poster (project, map, imagery) just sign up online.

This year's event is co-hosted by the Bay Area Automated Mapping Association (BAAMA) and Geospatial Innovation Facility (GIF), with support from the Northern California Region of the American Society for Photogrammetry and Remote Sensing (ASPRS).


Google Maps border becomes part of international dispute

(CNN) -- The accuracy of Google Maps has been pulled into a debate about the border between two Central American countries.

A Nicaraguan general cited Google's version of the border map as an after-the-fact justification of a reported raid of a disputed area between that country and Costa Rica.

http://www.cnn.com/2010/TECH/web/11/05/nicaragua.raid.google.maps/index.html

Had to do it: Giants' Parade Map released

The San Franciso Giants parade will be held Wednesday on Market Street. This is the first title for the franchise’s since they moved to San Francisco in 1958. The Giants lost the World Series in seven games in ‘62. They lost the World Series of ‘89 that was better known for the earthquake. They lost the World Series in 2002 though they had a five-run lead with eight outs to go. But who cares about all that old stuff now!


What the world needs: a global map of cheese

gotta love a map about cheese.And lots of other things as well. Check out this great global map visualization of world cartograms showing many resources. This one shows global production of cheese. Mmm. They say: with rising incomes, consumption of cheese has increased worldwide. The United States is the leading cheese maker, producing about 25% of the world's cheese and over 400 varieties. Greece and France are the largest consumers of cheese, each consuming over 50 pounds of cheese per person each year. Japan, Philippines and China are the newest markets demanding more cheese. Cheese around the world.

Yikes! GPS surveillance reported on NPR

One more for the privacy files. From NPR.org. When Yasir Afifi took his car in for an oil change, his mechanic found an unusual wire hanging from below. It was part of a black rectangular device attached to his car by a magnet. After posting photos of it on an online forum, where posters identified it as a GPS tracking device, Afifi, a Santa Clara, Calif., college student and computer salesman, got a visit from FBI agents demanding their equipment back.

The FBI confirms the device belongs to the agency and that agents visited Afifi to get it back. But Special Agent Joseph Schadler won't say why it was there. Full article


New conference: Mapping Global Change with Spatial Stats

23-25 March 2011, University of Twente, Enschede, The Netherlands.
Spatial statistics is a rapidly developing field which involves the quantitative analysis of spatial data and the statistical modelling of spatial variability and uncertainty. Applications of spatial statistics are for a broad range of environmental disciplines such as agriculture, geology, soil science, hydrology, ecology, oceanography, forestry, meteorology and climatology, but also for socio-economic disciplines such as human geography, spatial econometrics, epidemiology and spatial planning.

The aim of the meeting is to present interdisciplinary research where applicability in other disciplines is a central core concept.

Early Bird Registration: January 15 2011.

Mapping science and the city - from Nature

Suggested by Tim. Nature has a nice viz on where science happens, in terms of cities, and how publication output interacts with publication impact. Their analysis - provided to Nature by Elsevier - of Scopus data shows how absolute counts of publications per city and relative citation impact have changed from 2000 to 2008. The interactive graphics supplement the news feature 'Building the best cities for science' part of Nature's special package on Science and the city. Berkeley does quite well, by the way. Go Bears!

They also have the same information as a google earth viz. Very cool.

TanDEM-X and TerraSAR-X set to create global DEM by 2014 at 12 m spatial resolution

German based TanDEM-X and TerraSAR-X satellites, launched in 2007 and 2010 respectively, begin their tandem orbit flight to create a new global DEM product of the Earth's surface to be available in 2014.

The TanDEM mission seeks to produce a global DEM at 12 meter sp

atial resolution with a relative vertical accuracy of less than two meters. With this kind of specification "'the TanDEM dataset will replace SRTM'". The US Shuttle Radar Topography Mission (SRTM) of 2000 is one of the best-known, near-global, space-borne DEM prior to TanDEM. Its best product has a 30 meter spatial resolution, and a vertical accuracy that varies from 16m to 10m.

Airborne laser instruments such as Lidar can achieve finer spatial resolution and vertical accuracy but their products are regional - they are not seamless maps of the whole Earth as TanDEM will be able to achieve. For more read the full story here.

Back when maps were big and physical: giant 1924 relief map of CA found in SF

The giant "Paradise in Panorama" relief map of California, made in 1924, was displayed at the Ferry Building. Credit: Barney Peterson / The Chronicle 1963San Francisco's oldest and best-known white elephant - the huge three-dimensional relief map of California that once graced the Ferry Building - has turned up at an undisclosed location on the city's waterfront.

The map was one of the wonders of the West when it was unveiled in 1924. See article from SFGate.

It was as long as two football fields and showed California in all its splendor, from Oregon to Mexico, with snow-capped mountains, national parks, redwood forests, a glorious coastline, orchards and miniature cities basking in the sun. It was made of plaster, wire, paint, and bits of rock and sand. In the summer of 1924, Scientific American magazine said it was the largest map in the world.

Geospatial Revolution Project launched

Penn State Public Broadcasting has released the first episode of the Geospatial Revolution Project,"an integrated public service media and outreach initiative about the world of digital mapping and how it is changing the way we think, behave, and interact." 

These videos are a great resource for sharing the wonder of all things geospatial in an exciting and easy to understand format. Three additional episodes are set to be published throughout the year. 

View the site to watch the videos and learn more, and keep an eye out for Berkeley's own Kass Green who contributed to the project.

Mapping Traffic’s Toll on Wildlife

Roadkill and participatory GIS (two of my favorite topics) make it mainstream! A recent article from the New York Times describes a project out of UC Davis using citizen observers to map roadkill.

"Volunteers comb the state’s highways and country roads for dead animals, collecting GPS coordinates, photographs and species information and uploading it to a database and Google map populated with dots representing the kills. The site’s gruesome gallery includes photos of flattened squirrels or squashed skunks."

The project website can be found here: http://www.wildlifecrossing.net/california/

Read the NY times article here.

Clark Labs teams up with Google.org to develop web based land-cover analysis and REDD tools

Land Change Modeler for ArcGIS (Image used with permission from Clark Labs)

From Clark Labs news:

Clark Labs recently received a $451,000 grant from the Gordon and Betty Moore Foundation to support the development of land-cover analysis and REDD tools for use on Google's Earth Engine. REDD, Reducing Emissions from Deforestation and Forest Degradation, is a climate change mitigation strategy that offers developing countries incentives to reduce forest carbon emissions. The complex implementation of REDD relies on substantial computing and data resources, and requires significant effort and investment. It is hoped that providing accessible modeling tools with Google’s cloud computing resources and wealth of geospatial data will encourage broader adoption of REDD.

The grant supports the development of a prototype of the land change analysis and prediction tools for Google.org’s Earth Engine platform, a technology in development that enables global-scale monitoring and measurement of changes in the Earth’s forests. It is planned that Google will host the required geospatial data layers to implement a REDD project, including maps of those factors identified as critical causes of deforestation, such as proximity to roads, slopes or distance from existing deforestation.

The new tools in development will guide the user through the steps of baseline development--land change analysis of the reference, project and leakage areas of a project, the identification of the carbon pools and input of carbon density values, and the estimation of emissions for projected dates. This new functionality will also directly produce the multitude of tables and graphics for the carbon accounting reporting requirement of REDD. The preparation costs of REDD will be significantly reduced by the automation provided by these tools.

Clark Labs is based within the Graduate School of Geography at Clark University in Worcester, MA and is the developer of the IDRISI Taiga GIS and Image Processing software and the Land Change Modeler software extension to ArcGIS. To view the full news release click here.

Researching why animals move across the land

Collaring a zebraA very nice article about Wayne Getz's research in Africa: spatial ecology, epidemiology, conservation and citizen science. From Breakthroughs Magazine

In this article he talks about his evolution as a scientist from mathematician to geo-nerd. The article states: At the core of Getz’s work is how and why animals move across the land. People have sought answers to these questions for time immemorial - at first to improve success in the hunt and harvest, and much later to understand animals in and of themselves. His approach combines a mathematician’s genius for analysis with hands-on wildlife research. This unique perspective is revealing that animal travel patterns can provide a great number of insights into animal behavior, ecology, and epidemiology.

And now the GIS part: In recent years, the advent of global positioning system technologies, coupled with expanded telecommunications networks, have added up to a revolution in animal tracking. The modern version of the radio collar can map an animal’s position to within a couple of meters every few minutes, upload the stored data automatically to a satellite or cell phone network, and allow biologists to track the beast from afar for many weeks. 

Also read about his work in education and social justice in South Africa. Cool stuff. Check it.

The future is already here – it's just not evenly distributed. Or maybe it is.

William Gibson (yes that one) in the NYTimes Opinion page, writes about Google, and the way it has changed how we interact with information and the world. It is a really interesting article touching on human choice, surveillance, and the catch-up game the law plays with technology. This visionary author of Neuromancer says "Science fiction never imagined Google..." and goes on to describe its omipresence, our ready participation in this process, and our discomfort at the result. He is a fantastic writer. Check it:

Google is not ours. Which feels confusing, because we are its unpaid content-providers, in one way or another. We generate product for Google, our every search a minuscule contribution. Google is made of us, a sort of coral reef of human minds and their products.

Wow. Here is another example of his engaging and illuminating prose:

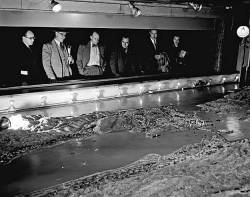
Jeremy Bentham’s Panopticon* prison design is a perennial metaphor in discussions of digital surveillance and data mining, but it doesn’t really suit an entity like Google. Bentham’s all-seeing eye looks down from a central viewpoint, the gaze of a Victorian warder. In Google, we are at once the surveilled and the individual retinal cells of the surveillant, however many millions of us, constantly if unconsciously participatory. We are part of a post-geographical, post-national super-state, one that handily says no to China. Or yes, depending on profit considerations and strategy.

The title of this post comes from his oft-cited quote in 2003 in The Economist.

*About the Panopticon from wikipedia: The Panopticon is a type of prison building designed by English philosopher and social theorist Jeremy Bentham in 1785. The concept of the design is to allow an observer to observe (-opticon) all (pan-) prisoners without the incarcerated being able to tell whether they are being watched, thereby conveying what one architect has called the "sentiment of an invisible omniscience."

GIF Open House Today!

Thursday, September 2, 1-3 PM 

111 Mulford Hall

Check out new equipment and find out how mapping technology can enhance your research! 

The Geospatial Innovation Facility (http://gif.berkeley.edu) will be hosting an open house on Thursday, September 2 at 1PM.  Meet UC students, faculty, and staff who are interested in geospatial applications, and learn how the GIF can help you to utilize technologies including GIS, GPS, Remote Sensing, WebGIS, and 3D Visualization. 

Root beer floats will be available while supplies last!

Welcome to Fall 2010 with this stunner of a pic from NASA

Mataiva Atoll, Tuamotu Archipelago, South Pacific OceanFrom the NASA Earth Observatory Image of the Day: The Tuamotu Archipelago is part of French Polynesia, and forms the largest chain of atolls in the world. This astronaut photograph features Mataiva Atoll, the westernmost atoll of the Tuamotu chain. Mataiva Atoll is notable in that its central lagoon includes a network of ridges (white, image center) and small basins formed from eroded coral reefs. Mataiva means “nine eyes” in Tuamotuan, an allusion to nine narrow channels on the south-central portion of the island. The atoll is sparsely populated, with only a single village—Pahua—located on either side of the only pass providing constant connection between the shallow (light blue) water of the lagoon and the deeper (dark blue) adjacent Pacific Ocean. Much of the 10-kilometer- (6-mile-) long atoll is covered with forest (greenish brown). Vanilla and copra (dried coconut) are major exports from the atoll, but tourism is becoming a larger part of the economy.

This is not a satellite image, but a photograph taken by the Expedition 24 crew from the International Space Station (I think) on August 13, 2010, with a Nikon D2Xs digital camera using a 400 mm lens. More here.


Everyone should listen to today's Fresh Air interview

Not directly map related, but might be. As I sit here with three screens, email open, working on multiple projects, including upcoming semester's lectures, AND listening to today's Fresh Air, I am struck dumb. In this interview, in which dear old Terry Gross reveals her late nite email addiction (et tu Terry?), the guest Matt Richtel (NTimes) reveals the answers to the following questions (and many more): Why is email addicting? Are there downsides to our constant focus on multiple influxes of infomation? What are the psycological and neurological underpinnings to this madness? The answers involve dopamine, stress hormones, declining capacity to concentrate and create, and a whole lot of scary.

Are there parallels or lessons for us in our deluge of map-related technology and data? Yikes!