The structure of a city via Twitter

From Mashable Tech.

Check out this gorgeous visualization of NY City's tweetopolis from Oakland-based programmer Eric Fischer.

He plots out the motion of New Yorkers using public tweets on Twitter with geotags from May 2011 until January.

The project lays out around 10,000 geotagged tweets and 30,000 point-to-point trips in cities like New York City to plot the flow of people in terms of favored paths. In his map of NYC, seen above, there is a huge ink blot lining Broadway; as we’ve long suspected, it looks like the busy avenue is the backbone of the city.

Using a base map from OpenStreetMap, he drew out transit paths using Tweets. Movements are indicated on the geolocation of a Tweet, with an individual’s start point marked with one geotagged Tweet and ending with the next geotagged Tweet. This is what creates a mass of traffic routes.

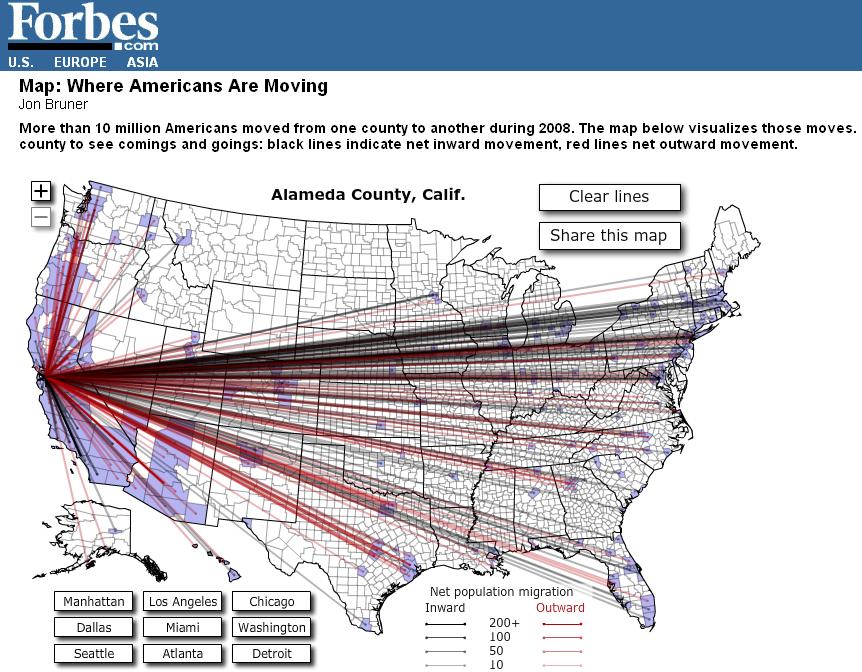
Similar viz of the east bay“If you just draw lines from the beginning to the ending of each trip, you get a big mess, so the challenge is to come up with more plausible routes in between,” Fischer told Mashable. “That is where the 10,000 individual geotags come in, the most plausible routes are ones that pass closely through places that other people have been known to go.”

Fischer used Dijkstra’s Algorithm to calculate what exactly to map out. For those of who haven’t thought about math since high school algebra, that’s an equation that maps out the shortest path between two points on a graph. For this project, the equation pointed to the relevant paths to map out a city’s most dense corridors.

This might be of use for our mobility project with our space.

More here.

Artisan basemap sandwich - a great name for a band, and a new basemap from ESRI

An example from southern caliEver admired those lovely muted gray maps from NYTimes and elsewhere that are in vogue now? Subtle, calming, with great figure to ground contrast? Canvases on which your data can pop? I know I have. Now ESRI cartographers add these options to their basemap collection. Read more about it in these posts:

Esri Canvas Maps Part I: Author Beautiful Web Maps With Our New Artisan Basemap Sandwich, and Esri Canvas Maps Part II: Using the Light Gray Canvas Map effectively.

From Greeninfo Network.

To map or not to map

A recent post by Matt Ericson from the New York Times on the importance of knowing when to map geographic data and when not to. He states that we are sometimes too quick to map geographic data. In some cases a chart or table can better represent geographic information and tell a more effective story. In some cases there are no better alternatives than to map geographic data. The important thing is to remember that there are multiple avenues of presenting geographic data in which a map may or may not always be the best form to convey data and ideas. In the post he also provides examples of some cases he has run in to where a map and where a table has provided a more effective means of geographic data presentation.

See the full post here.

India-Pakistan border as seen from space

From NASA re-posted via Bostom.com's The Big Picture photojournalist website comes this fascinating, geographically-pertinent image: "The India-Pakistan border appears as an orange line in this photograph taken by the Expedition 28 crew on the International Space Station on August 21, 2011. The fence between the two countries is floodlit for surveillance purposes. Srinagar (left), Islamabad (bottom center), Lahore (center near the border line) and Delhi (top center) can be seen as brighter spots. (NASA/Handout/Reuters)#"

Sacramento - vulnerable to levee breaks

Sacramento's levee system: levees are in orange, the inset is the capital under floodwaters.A good article from NYTimes discussing the vulnerability of Sacramento to levee breaks. Scientists consider Sacramento — which sits at the confluence of the Sacramento and American Rivers and near the delta — the most flood-prone city in the nation. The city is at risk from earthquake-damaged levees and storm related flooding.

London Mapping Festival: 18 months of all things maps + london. Sign me up.

The London Mapping Festival 2011 – 2012, or LMF for short, is an exciting and unique initiative being launched in June 2011 and will run through to December 2012. It sets out to promote greater awareness and understanding of how maps and digital geographic data are being created and used within the Capital.   Through a diverse range of activities LMF will engage with a wide audience of mapping enthusiasts whether they are professionals, enthusiasts or others. We should do something like this for the SF Bay Area. More here.

The City Project: Park Poor, Income Poor, and People of Color

example from orange countyThe City Project has released a report for California analyzing access to green space.  The report uses geographic, demographic, economic and historical data to map and analyze access to the region's green space. In addition, the report examines access to green space based on income, race or ethnicity.
The report's GIS maps were produced by GreenInfo Network and help illustrate unfair disparities in park access.

The areas that are symbolized with red and crosshatching indicate areas that are park poor (less than 3 acres of parks per 1,000 residents) and income poor (below $47,331 median household income), and disproportionately populated by people of color.

the world according to facebook

From the BBC: Using some of the information on friends data from facebook's 500m members, intern Paul Butler has constructed an interesting map of the world's connections. The map above is the result of his attempts to visualise where people live relative to their Facebook friends. Each line connects cities with pairs of friends. The brighter the line, the more friends between those cities.

21st century maps are commercial products, not national efforts

From the Map Room. Popsci has an interesting article about "how digital maps are changing the landscape of the 21st century". Among the interesting bits is this RAD image, showing a moving plane captured by the GeoEye satellite. But the main argument is that mapping used to be the purview of nations and international bodies, but now commercial entities like Google, Bing, Mapquest, and other digital services are the principal mapmakers of the 21st century. Now, maps are commercial products, compiled from a variety of sources that often blend government-derived mapping data with user-generated content. The article suggests they are subject to conflicting information, differences of political opinion and outright error. In addition, the article claims we haven't really focused on this transfer of cartographic power, but of course many have commented on this (e.g. Goodchild's VGI article frfom 2007 in Geojournal) in the academic world.

The mapping brain

This is an interesting article from National Geographic about "The Map and the Mind", which makes the argument that our intellectual maturation as individuals can be traced through the way we draw pictures, or maps, of our surroundings, and that the humble map helped “advance the evolution of abstract thinking” throughout society.

"Nicholas Carr’s new book, The Shallows: What the Internet Is Doing to Our Brains, examines how our intellectual technologies—the tools we use to find, store, and share information—influence the way that we think, from the map and the clock to the book and the Internet. In this excerpt, Carr looks at the map’s far-reaching effects on the intellectual lives of our ancestors."

I assume in the book he talks about internet mapping and LBS, but that will have to wait until I can get my hands on the book.

What the world needs: a global map of cheese

gotta love a map about cheese.And lots of other things as well. Check out this great global map visualization of world cartograms showing many resources. This one shows global production of cheese. Mmm. They say: with rising incomes, consumption of cheese has increased worldwide. The United States is the leading cheese maker, producing about 25% of the world's cheese and over 400 varieties. Greece and France are the largest consumers of cheese, each consuming over 50 pounds of cheese per person each year. Japan, Philippines and China are the newest markets demanding more cheese. Cheese around the world.

Maps as Media: Map making in the 21st century

Today's "On the Media" radio show included a great discussion of maps and map making in the Google era. Largely a synopsis of this article in the Washington Monthly by John Gravois, the radio piece, with John Gravois, touched on the decline of the National Map and the rise of the Google Map paradigm, and the consequences of this change: how does Google name features that are in dispute? what do maps mean as their lineage changes from government to corporation? how do the political nuances of national maps change as Google becomes the global standard for map making? do we need a new term for these increasingly community based collections of spatially tagged conversations? It was a really interesting piece, and I recommend it. Good listening.

If San Francisco Crime were Elevation

From Doug McCune's blog, the motto of which is: "I was Web 2.0 before your grandma was Web 2.0" which is kinda cute, gotta admit. Not that my grandma was ever anything close to that, she was a great baker though.

Anyway - he says: "I’ve been playing with different ways of representing data and I decided to venture into 3D representations. I’ve used a full year of crime data for San Francisco from 2009 to create these maps. The full dataset can be download from the city’s DataSF website." These are really rad and interesting.

He's chosen a solar illumination from the east, as it would be during sunrise.

He has a disclaimer: "These maps were generated from real data, but please don’t take them as being accurate. The data was aggregated geographically and artistically rendered. This is meant more as an art piece than an informative visualization." which is valid, but these are still really nice.


california map society website

The California Map Society has just launched a cool new website.  I am a member, I like these guys and their message. They say it well:

We are passionate about all phases of cartography in its broadest sense. We are fascinated by the potential of remote sensing, GIS, and the tools for today’s digital mapmaking. Yet we love the art and history embodied in antique maps. Understanding man’s continuing change in perception of his environment and world is part of the fun of viewing old maps. And we never fail to delight in the curious forms that maps have taken over the centuries.

Check out the website here.

Some nice global cartograms via worldmapper.org

From www.worldmapper.org at the University of Sheffield, via the BBC.  All mapmakers must select a projection for their maps. Projections, especially for regional and global maps, can convey political messages, whether intended or not. The following show cartograms whose projections are based on factors other than polar coordinates.

First, these global examples from the Atlas of the Real World (more at their website).

Human poverty cartogramThe size of each territory shows the overall level of poverty, quantified as the population of the territory multiplied by the Human Poverty Index. The index is used by the UNDP to measure the level of poverty in different territories. It attempts to capture all elements of poverty, such as life expectancy and adult literacy. The highest index scores are in central Africa; the lowest in Japan.

Next, these population cartorgrams.

Spain's population cartogram

This example (chosen in honor of Celia) shows the dominance of Madrid and Barcelona in Spain's population. There are many other examples, and a nice flash app.

New Interface for the Manhatta Project. Check it.

We talked about this before here; and the Manhatta project has a nice new interface for exploring the 1609 map of the island of Manhatta(n), block by block, through time.  I love this project! The combination of mashup, history, design and art are breathtaking.  (And our own Tim Bean worked on reconstructing the early topography! - see his comment below.) Go Fullscreen on your 30"-monitor. I dare you.

“The goal of the Mannahatta Project has never been to return Manhattan to its primeval state. The goal of the project is discover something new about a place we all know so well, whether we live in New York or see it on television, and, through that discovery, to alter our way of life. New York does not lack for dystopian visions of the future…. But what is the vision of the future that works? Might it lie in Mannahatta, the green heart of New York, and with a new start to history, a few hours before Hudson arrived that sunny afternoon four hundred years ago?”

- from Mannahatta: A Natural History of New York City

It's hot down there! New map of the London tube hot spots.

I have a real fondness for the London Underground, having spent many hours on it as a child and teenager, but also because of the role the first tube map played in transportation cartography and 20th Century design, so nicely described in Bill Bryson's Notes from a Small Island.  From a BBC website devoted to the map: the map was devised in the 1930s by Harry Beck, who worked on it throughout his life, trying to improve and modify it. A nice website that captures this evolution is here. Many of the world's cities use a similar "non-geographic, electrical wiring" design for their public transport maps.

Luckily, many of my hours on the Tube were on the cooler Jubillee Line, and not on the Central Line. A new map compiled by Transport for London (TfL) has revealed the hottest spots on the Tube network, notorious for its lack of air-conditioning.  For many, it proves that London has indeed become a melting pot. The Central Line — which serves some of the most popular tourist spots such as Oxford Street and St Paul’s Cathedral — is one to avoid on a hot day.  The Central Line boasted some of the highest temperatures when the heat map was compiled on July 28 last year — the hottest day. Many sections of the tube reach over 30C (86F). Full-size graphic:  Graphic: underground hotspots. From the Times, via the Map Room.