King fire near Blodgett Forest Research Station

From UC Center for Forestry.

9/16 16:30 - The King Fire started the evening of September 13 east of Pollock Pines. On 9/15, it grew to 3,900 acres. By the morning of 9/16, it was over 11,000 acres and 5% contained. 

As of the afternoon of the 16th, the fire is alarmingly close to Blodgett Forest Research Station. All staff are being evacuated.

We will provide updates here as they come in. We anticipate the perimeter update will be updated every 24 hours in the early morning (as the data becomes available).

The last update was 9/16 at 10:00AM.

EVACUATION INFORMATION CAN BE FOUND HERE http://inciweb.nwcg.gov/incident/4108/

For questions, please contact carlinstarrs@berkeley.edu

For more information visit: 

Meadow fire update, burning in Little Yosemite Valley

It's now on Inciweb. The Meadow fire is burning near Yosemite, at the east of Little Yosemite Valley.

From Yosemite NP:

As of 11-9:

The Meadow Fire has progressed rapidly and in multiple directions. In order to maintain the safety of park visitors and allow fire management operations to continue unimpeded, the Superintendent of Yosemite National Park is designating a portion of Yosemite Wilderness as closed. The area will be closed until further notice is given.

As of 11-8:

"Meadow (37 42.738 x 119 30.541 – Mariposa Co., 7,870’, August 16) A fire, that may be a spot fire, from the Meadow lightning-caused fire, was discovered at approximately 12:30 PM, Sunday September 7. The fire is approximately 2,582 acres. It is burning within the Little Yosemite Valley (LYV) on both sides of the Merced River. All trails in the area are closed. Approximately 100 hikers and backpackers were evacuated from the fire area in LYV. The fire is burning in Yosemite Wilderness. The High Sierra Camps were seasonally closed today."

Scott Stephens says it is growing fast. We will keep our eyes on it.

New VTM reshot, from Tim Hanson

This one from Tim Hanson. The caption from the photos (286747. 286748, 286749, 286750) reads:

"Butte County. Panorama looking SW, S. SE and E from Neal Road. Note Juniperus californica in ravine. Woodland grass type of blue oak and digger pines with occasional Ceanothus cuneatus, Arctostaphylos manzanita and Rhus diversiloba."

There is still California juniper in the ravine, including far right of the new photo, which is uncommon in Butte County. The rare Monardella venosa grows in patches of dense clay soil in the flats of the canyon. The Wieslander picture was taken on 6/24/1933 and his picture was taken on 5/3/2011.


New VTM photo reshoots from Joyce - check it!

Joyce Gross is our most avid VTM photography buffs. Here are two new VTM reshoots for our viewing pleasure. Her original post here, and here are all her new photos on CalPhoto.

She says: This was the first VTM photo site I've found that required a hike to get there. Not only was the photo not taken from a road, but it was not taken from a trail. The hike from my car to the site was a little over a mile, but it felt like more. It was all uphill, and we didn't really know where we were going. The first 2/3 of the hike was along a narrow, rocky road (image below). The last third of the hike involved somewhat random wandering over rocks and around bushes towards a view we hoped to see but weren't sure exactly where it was. My Garmin GPS, and Gaia GPS on my iPad, were my friends on this hike, helping us get to the photo location and, especially, helping us get back. Thanks Joyce!

Upper end of French Lake and Black Buttes. One of the largest natural barren areas on the Colfax map.Joyce's photograph


French Lake and English Mt. Looking north, 45 degrees west. Large area of barren and semi-barren Quercus vaccinifolia.Joyce's photograph of French Lake

Measuring Development: Energy & Environment

I spoke yesterday at the CEGA-DIME* co-sponsored event: Measuring Development: Energy & Environment.  This was a terrific day of interesting talks, thoughtful conversations and great networking.

This workshop brought together engineers, social scientists, donors, and practitioners to discuss the use of novel measurement tools--including sensors, sensor networks, microsatellite imaging, and other remote sensing technologies--in energy and environment research. 

I presented an "ignite" talk on some of our mapping work and talked about the idea of "Spatial Data Science". There were a number of highlights. Matt Hancher from Google gave a great overview of Google Earth Engine and asked: "What if the micro-satellite imagery revolution works. What will you do with the data?” Great and timely question. Big Spatial Data workshop to the rescue! We heard from people at the Energy Institute at Haas who are looking at smart sensors, iButtons and billing networks to understand energy usage around the world; Ronald Cohen from the Climate Readiness Institute spoke; there was tons of discussion about low earth orbit micro-satellites from Skybox and the Spire company (they monitor AIS beacons on ships yet they also can still find them as they move back and forth through fishing zones and turn off their beacons); there was a great idea from Tony Vodacek from RIT on the need to develop “a remote sensing playbook”: What are the sensors, resolutions, bands that are needed for a particular task?. David Lobell from Stanford highlighted some of his great work in remote sensing of crop yields; and Sol Hsiang from the Goldman School outlined his fascinating work on natural disasters, economies and violence.

Background: Technologies for measuring the adoption and impact of development interventions have seen substantial innovation over the past several years—examples include the use of microsatellite data for mapping weather patterns and agricultural yields, sensors for tracking behavior change, smart meters for recording real-time energy use, continuous emissions monitoring systems for measuring particulate matter, and platforms for smartphone- and tablet-based survey data collection. At the same time, network protocols for data management, visualization, and analysis have drastically improved.

*CEGA =UC Berkeley's Center for Effective Global Action; DIME = World Bank's Development Impact Evaluation Initiative

Graduate Certificate in GIST up and running

The UC Berkeley Graduate 
Certificate 
in
 Geographic 
Information 
Science 
and
 Technology
 (GIST)
 has been approved, and is up and running. This certificate will provide
 an 
academic
 structure 
for 
an 
interdisciplinary 
exchange 
of
 ideas 
around
 geospatial
 information 
and 
analysis.

Certificate
 students 
will
 not 
only
 participate 
in
 a 
cutting‐edge 
program 
and
 receive
 explicit
 recognition
 of 
specialization 
in
 GIST
 by 
virtue 
of
 the
 Graduate
 Certificate 
but
 will 
be
 well
 positioned
 to
compete
 for
the
 most
 desirable 
jobs 
in 
geospatial
t echnology,
 both 
in
 academia
 and 
in 
industry.

Requirements include at
 least 
three 
courses, 
or 
a
 total
 of
 90 
hours
 of
 instruction, 
and
 earn 
a
 minimum 
grade
 of
 B, and participate in a GIST Roundtable (such as the geolunch series from the GIF). The full proposal detailing requirements can be found below. Please note that acceptable courses will be updated as new courses are offered. 

For more information, please click here.

NOTE: THIS CERTIFICATE IS FOR CURRENTLY ENROLLED GRADUATE STUDENTS AT UC BERKELEY. It is not a professional GIS certificate for non-students.

Summer 2014 Wrap Up

What we worked on summer 2014

VTM collection

Like old maps? Have we got a project for you... For more than 10 years now I have been working on and obsessed with the maps and data from the Wieslander Vegetation Type Mapping project. The original collection has been digitized, and both the analog and digital version are finally being reunited under the auspices of HOLOS. Stay tuned for the launch!

Vegetation maps courtesy of Shufei Lei

Owls and Lidar, and more broadly remote sensing of owl habitat

What is the best way to map owl habitat? Owls need canopy cover, moderate tree sizes, and large residual trees. What is the best way to map these forest characteristics over large scales? We are working with the Forest Service owl biologists to understand how owls use Sierra Nevada forests.

SNAMP

Our nearly 10 year project to establish an adaptive management process in the Sierra Nevada is coming to an end this year. We have learned so much, and are working on our final report that will be shared later this fall.

On the staffing side

We are so happy for Kevin Koy who is leaving the GIF to be the Executive Director of the Berkeley Institute for Data Science. We are actively searching for his replacement. If you are interested, look here.

Google Geo for Higher Education Summit 2014


Just got back from an amazing workshop with the Google Earth Outreach Geo Team and 50+ geospatial educators, researchers, and lab managers! 

In between stealing off on the colorful google bikes  and spending time wandering the amazing Google campus, we engaged each other in discussions of integrating Google tools into higher education and learning and attended workshops introducing the plethora of Google mapping tools.

We had a warm welcome from Brian McClendon (VP of Engineering, Geo at Google, mastermind behind Google Earth, and creator of KML) who gave a great history of the program and the creation of Google Geo and gave an exciting announcement that Google; with the acquisition of Skybox is now taking to the sky with their own satellites in hand (contrary to popular belief, Google has not to this point owned any Satellites).  With this acquisition, near-real live time imagery on Google platforms seems to be closer than ever before.

Rebecca Moore (Engineering Manager, Google Earth Outreach and Earth Engine) also gave a great history of the importance of Google Earth and its transformation over the years highlighting a number of exiting things to come and products not yet released to the public including

1. A new MODIS time-lapse!

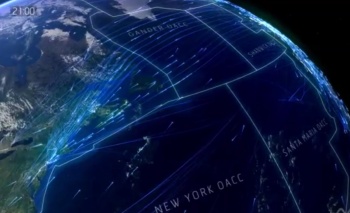
From Maggi’s blog post last year on timelapse created from LANDSAT imagery we saw the amazing capabilities to see transformations over time with the click of a button. Now Google will soon release MODIS time-lapse which having a quicker repeat interval will be able to show seasonal changes .

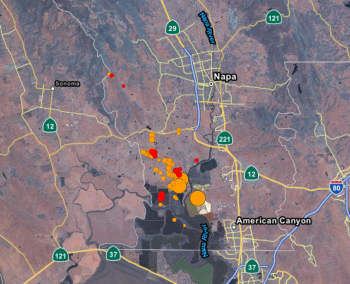
Check out this example here showing fires across the world, and more targeted video here! Awesome!

2. Also great news for those of you tired of the coarse resolution SRTM 90 DEM, Google is currently working to produce a much higher resolution global DEM product…stay tuned!

Throughout the 3 days, I had the opportunity to attend a variety of different workshops and came away absolutely jazzed! See below for a summary of the latest and greatest from the Google Geo team with links attached if you’re interested and want more information….. Also stay tuned for some of my renderings and products from the training!

Google’s “Ecosystem” of Technologies

Mapping:

Google Maps Engine (GME): hosting data and publishing maps online, and ability to build applications and connect Google’s data with your own.

GME Pro&Lite: simple map making in the cloud, visualize, draw, import a csv, and style your maps

Maps Gallery: A new way for organizations and public institutions to publish and share their maps online through the Google maps Engine

Google Crisis Map: a map interface initially used for emergency alerts, however it’s not entirely dedicated to crisis as you can easily integrate and create your own map mashup and community awareness map here

Maps Engine API (application program interface): to access Maps Engine data, create a new applications utilizing the data, stylize and create beautiful maps

Analysis

Google Earth Engine: (EE), Google’s geospatial analysis platform. Earth Engine brings together the world's satellite imagery — trillions of scientific measurements dating back almost 40 years — and makes it available online with tools for scientists, independent researchers, and nations to mine this massive warehouse of data to detect changes, map trends and quantify differences on the Earth's surface.

Earth Engine API (application programming interface) provides the ability to create your own algorithms to process raster and vector imagery.

Timelapse builds on Earth Engine to show decades of planetary change, both man-made and natural

Data Collection

Streetview: in Google Maps and Earth provides over five millions miles of interactive 360-degree panoramas across all seven continents; it’s the closest thing to teleportation, allowing teachers and students to virtually walk almost anywhere they dream of going. Street View began on the roads, but new technologies like theTrekker backpack or an underwater rig can take you almost everywhere.

                -Treks: Street view special collections (museums, up a mountain,etc..)

                -Views: streetview imagery crowd-sourced from user generated 360 degree photospheres. You can now connect your photospheres to create your own street view using constellations

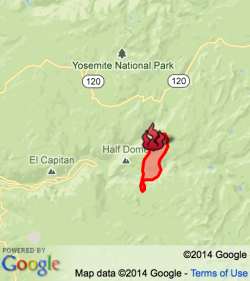
Mobile Data Collection using Open Data Kit allows you to collect field data, such as text, photos/videos, and GPS location from an Android device where there's no internet connection and then publish that data to the web when you're back online. You can then export your data into Google Earth Engine for mapping and Google Fusion Tables for graphing, mapping and visualization. 

Visualization/ Story Telling

Tour Builder: Tour Builder is a new way to show people the places you've visited and the experiences you had along the way using Google Earth. It lets you pick the locations right on the map, add in photos, text, and video, and then share your creation. The new geo-enabled Powerpoint!


Thanks to Maggi for the opportunity to attend and the talented, enthusiastic Google Geo staff (including: Karin Tuxen-Bettman, John Bailey, David Thau, Christiaan Adams, and all the other workshop leads and those behind the scenes!) for developing such an action packed workshop!

Find related research based on location and biophysical attributes: Map search

Check it out: another way to search for research. JournalMap is a scientific literature search engine that empowers you to find relevant research based on location and biophysical attributes combined with traditional keyword searches. It works ok, I found one of my papers, not others. But the interface it quick and intuitive.

http://www.journalmap.org/

IGIS at ESRI Conference

Two members of IGIS - Shane and Robert, went to the the ESRI User Conference in San Diego this year. 

Here is their report:

We were able to see the new offerings from ESRI that will be available in November of this year.  ESRI will be releasing ArcGIS 10.3, this incremental release will have many improvements as well as new offerings that IGIS will be able to make available to the UCANR GIS Community.  These new offerings will include ArcGIS Pro http://pro.arcgis.com and Portal for ArcGIS http://www.esri.com/software/arcgis/arcgisserver/extensions/portal-for-arcgis.

ArcGIS Pro is a new desktop application that will be available to all users of GIS within UCANR.  ArcGIS Pro is a multi-threaded, 64-bit, project based GIS system that provides a fast responsive desktop application for the GIS professional. It will allow user to have multiple layouts in one document.  It will enable the GIS user to have 2d and 3d layouts available in one project.  It is what we as GIS users have been requesting for many years.

Portal for ArcGIS prior to the 10.3 release of the ArcGIS Suite was an extension for ArcGIS Server that had to be purchased separately from ArcGIS Server.  In November Portal for ArcGIS will be available for UCANR to install on the ArcGIS Server and it will provide a user interface similar to arcgis.com but within the UCANR intranet.  This will open up some interesting options for UCANR.

Beyond these two additions we will be providing access to a new open data extension for ArcGIS Online and ArcGIS for Cad.  The open data extension will allow us to provide an open data portal where the UCANR Network and the general public can go to download our data for use in other geospatial technologies.  We will provide the ability to download certain data types such as, shapefiles, kml, or csv files.  The ArcGIS for Cad extension will allow cad users within UCANR to leverage ArcGIS resources with Autocad.  This will allow UCANR to update our cad drawings of our infrastructure and have drawings with the proper coordinate system and additional attributes that are not available with Autocad.

Beyond these upcoming software releases and tools the ESRI User Conference was a wonderful opportunity to renew old and create new relationships with other GIS professionals and to see how others are using GIS around the world.  I look forward to putting these new technologies in place in the next year and to hopefully attending the user conference again in 2015.

Update from the White House on their Climate Data Initiative

Yesterday the White House launched the second phase of the Climate Data Initiative, focused on leveraging climate data and innovation to make food systems more resilient to climate change and reduce the impact of agriculture on climate change.  We are delighted to have a range of Administration announcements and private sector commitments that came together for today’s news.
 
Here is a fact sheet describing what they are announcing today: http://www.whitehouse.gov/the-press-office/2014/07/29/fact-sheet-empowering-america-s-agricultural-sector-and-strengthening-fo
 
And here’s a blog from White House Science Advisor John Holdren and Secretary of Agriculture Tom Vilsack on the launch: http://www.whitehouse.gov/blog/2014/07/29/unleashing-climate-data-empower-america-s-agricultural-sector

Please share these widely with your partners and networks. Thanks for your support for the initiative and your commitment to acting on climate change!

Planning for the future: core values, mission statements, and strategic thinking

I've been working on two strategic plans for programs and facilities I am directing: GIF and IGIS, and am thinking about what are the key elements in such a plan that communicates clarity, purpose, and mission. The current thinking out there seems to be to think about not just Mission and Vision, but also Core Values. Here is one from ANR that can help me think through my tasks.

ANR Mission, Guiding Principle, and Core Values

Mission

The mission of the University of California Division of Agriculture and Natural Resources is to serve California through the creation, development and application of knowledge in agricultural, natural and human resources.

ANR Guiding Principle

ANR’s research and extension programs serve the public good of California through the creation, development and application of knowledge addressing critical issues in agricultural, natural and related human resources, through a system of community-driven research and outreach programs with CE advisors, CE specialists, and AES scientists supporting each other.

ANR Core Values

  • The highest standards of ethical behavior, honesty and integrity, with the recognition that the trust and confidence of the public is absolutely essential to our success.
  • Academic excellence and maintaining credibility as an objective source of knowledge.
  • Scientifically valid research as a foundation for anticipating problems and developing practical solutions.
  • Responsiveness to state and local needs in California, and consideration of the global context that shapes these needs.
  • Diversity within our organization, equal access to knowledge by all people, and equal opportunity for self-reliance through education.
  • Collaboration, teamwork and mutual respect among ourselves, in partnership with other organizations, and in interaction with our clientele.
  • Academic freedom, with the recognition that individual freedom goes hand in hand with a high standard of professional responsibility and personal accountability to ANR’s land-grant mission.

NEW VTM Reshoot!

Take a look at this awesome VTM reshoot from the folks over at Geographic Resource Solutions (GRS), photographed during a recent mapping project of Lassen Volcanic National Park. Yet another great example and an incredible testament to lasting power of the VTM dataset. This particular photo was taken near the Chaos Crags Jumble in Lassen Volcanic National Park. Thanks to Ken Stumpf and GRS for sharing!

Albert Wieslander (October 1, 1925): Looking N 35 degrees W from 1/4 corner 16/17 T 31-4. Foreground dwarf timber on glacial deposit. Slope in background, section 7 and 8 Tyler Brown of GRS (September,2011): At Accuracy Assessment Site 091646 located in the Chaos Crags Jumble in Lassen Volcanic National Park

In a similar vein I recently stumbled upon another meshing of historical and contemporary photographs. The project features reshoots of the Grand Canyon and resulted in a 2012 book titled: Reconstructing the View: The Grand Canyon Photographs of Mark Klett and Byron Wolfe

Published by University of California Press. You can see a few of the photographer’s recent projects on their website. Historical photos are just the best!


Rescuing historic data for modern use: a cautionary tale from the past

An example of a VTM vegetation map, from Shufei LeiWe have been talking recently with the HOLOS project and the IGIS InfoBase project about the need to "rescue" data and to provide frameworks for data synthesis. I present to you a profound example of these needs: the VTM project. We have launched the new VTM website, in which the maps, plots, and photograph portions of the VTM collection are united and powered by HOLOS, open data, and sharing. The journey from paper collection to digital data has been a long one, with several cases of almost accidental and purposeful destruction. As such it is a cautionary tale about the importance of rescued and shared historical data in ecological and geographical analysis. We owe much to all the people who have contributed to the preservation and digitization of this important collection.

I spent this evening reading the oral history conducted in 1985 by Ann Lange of Albert Wieslander. It is called: California Forester: Mapper of Wildland Vegetation and Soils A. E. Wieslander, and it is a fascinating read. In addition to being a real spitfire and having very clear opinions on things (and people), he also tells this tale about the near loss in 1952 of the vegetation maps. Wieslander had made 23 of his vegetation maps available for publication through the University Press, for production and sale at a cost of $1 each. This was meant to supply funds for the rest of the maps to be published. But that didn't work out as planned.

"Not very many of the maps were sold, even though articles were written to give them publicity. I realized fairly soon that we wouldn't be able to publish any more unless we got additional money someplace.” He was "casually told one day that the University Press had written a letter to the station saying that the maps weren't selling very well, and it wanted to return the quadrangles to the station. They didn't want to handle it anymore.” A forest service employee "told the University Press the station didn't want the maps back and authorized it to dump them. I didn't know anything about this until after it was done. There was nothing I could do about it then. Imagine all these beautiful maps. They didn't even take out one as a sample.”

What!! That is so shortsighted… Anyway read on…

Wies (he refers to himself "Wies" in the interviews) then found out that the University Press couldn't understand the dumping of all those maps and alerted Paul Zinke, Forestry Professor here at Berkeley.

"So Zinke went down and got twenty copies of each of the quadrangles.”

But, we still had all the original field maps, kept at the experiment station. Just before I retired, I talked with Herbert Mason about all the printed maps having been destroyed and about how it was important to preserve the originals. Researchers could use them. He suggested that the Botany Department set up in the Life Sciences Building a plant geography room. And the main feature of this plant geography room would be the vegetation mapping project. So I moved all the files of maps and sample plots over to the Life Sciences Building. Mason went through the material and found at least a third, maybe more, of the original maps were gone.” Apparently, different national forests had been writing to the station requesting certain maps. Since they didn't have any of the printed maps, originals were sent out, with no record kept of what was sent, or to whom. 

This explains why the maps have been scattered across the state, and why it has taken so long to pull them (mostly) together again. 

"The maps then made a trip back to the station, where Dr. William Critchfield used them to write a publication called "The Profiles of California Vegetation”. "Anyway, I'm glad that was done. It was a very nice publication, and it gave proper credit to the draftsman who did the beautiful job of drafting, and to the project, and to me. Then Critchfield also worked with James Griffen, of the university, and got out another publication on "The Distribution of Trees in California." It was based on the maps and other data we had." When Wies expressed "concern about these maps and Dr. Critchfield said, "I would like to get them deposited in the Bancroft Library." I don't know whether he did it or not, but that's what he told me.”

Thank goodness that they are back on campus in the Marian Koshland Library (and for this we are forever in debt to the wonderful Norma Kobzina), and the plot data, plot maps, vegetation maps, and photographs will be re-united and available for use.

OakMapper Mobile Updated (v2.4) - available now at the App Store

OakMapper Mobile has been updated (version 2.4) to take take advantage of the latest iOS interface design and requirements. It is available for download at the Apple App Store. Existing OakMapper Mobile users are encouraged to update to the latest version.

In the last 6 months, the site receives over 1,100 visitors, resulting in over 1,450 sessions this period, which is consistent with the same period last year. Visitors come mostly from the US; and within the US states, California dominates. There are 14 new registered users from the community. Participation from the community includes 4 new SOD submissions (721 total), 1 new comment about SOD, 6 new questions/feedback, and 2 new votes on whether they have seen the reported SOD cases.

Our paper published in the Annals of the Association of American Geographers has been cited 17 times according to Google Scholar.


Connors, J. P., S. Lei & M. Kelly (2012): Citizen Science in the Age of Neogeography: Utilizing Volunteered Geographic Information for Environmental Monitoring, Annals of the Association of American Geographers, 102(6): 1267-1289

Advice on writing a clear scientific paper, from Virgina Dale

Advice on writing a clear scientific paper from Virgina Dale, Editor-in-Chief of the journal, Environmental Management since 2001. She says:

  • Scientific papers are not mystery novels. It is important to present the key results in the abstract of the manuscript and to have the introduction of the paper make clear both the impetus for the study and what is be presented in the manuscript.
  • Authors need to give the greatest attention to the parts of paper most likely to be read. Most people do not read a scientific paper from beginning to end but rather first focus on the title, then the abstract, and next the figures and tables. If the information presented is of interest, then the conclusion will be perused. Only those studies that have particular pertinence to the reader will be read in their entirety.
  • Organization of the material is critical. Almost all scientific papers should follow the standard format: introduction, methods, results, discussion, and conclusion.
  • Authors should check that the methods are complete and that most figures and tables are presented in the results section.
  • Each paragraph should start with a strong topic sentence, which presents the main idea and hence is an overview of what is to come. The concluding sentence should summarize the paragraph and provide a logical flow to the next one.

Dale, V. H. 2014. Environmental Management: Past and Future Communications. Environmental Management  54:1–2

ASPRS UAS Technical Demonstration and Symposium – October 21-22, Reno, Nevada

The ASPRS Northern California Region is hosting a 2-day symposium on unmanned aircraft systems (UAS) in Reno, NV on October 21-22, 2014. The purpose of the event is to assemble academia, UAS developers, survey and mapping companies, government agencies, and UAS enthusiasts, to share information, showcase new technologies and demonstrate UAS systems in action (in flight). The event will be held at the Reno Stead Airport, an FAA-designated UAS test site, as well as at a symposium hotel in downtown Reno. The mission of the event is to advance knowledge and improve the understanding of UAS technologies and their safe and efficient introduction into our national airspace, government programs and business.