Wrap up from the FOODIT: Fork to Farm Meeting
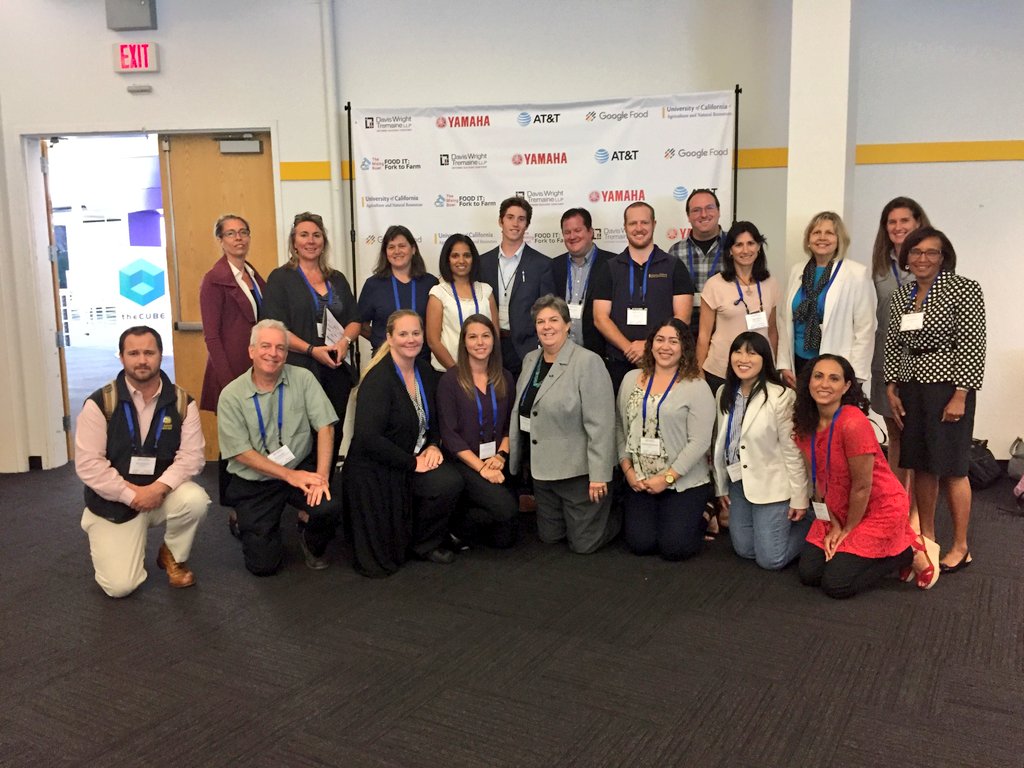
UC ANR was a sponsor for the FOODIT: Fork to Farm meeting in June 2017: http://mixingbowlhub.com/events/food-fork-farm/. Many of us were there to learn about what was happening in the food-data-tech space and learn how UCANR can be of service. It was pretty cool. First, it was held in the Computer History Museum, which is rad. Second, the idea of the day was to link partners, industry, scientists, funders, and foodies, around sustainable food production, distribution, and delivery. Third, there were some rad snacks (pic below). 

We had an initial talk from Mikiel Bakker from Google Food, who have broadened their thinking about food to include not just feeding Googlers, but also the overall food chain and food system sustainability. They have developed 5 "foodshots" (i.e. like "moonshot" thinking): 1) enable individuals to make better choices, 2) shift diets, 3) food system transparency, 4) reduce food losses, and 5) how to make a closed, circular food system.

We then had a series of moderated panels.

The Dean's List introduced a panel of University Deans, moderated by our very own Glenda Humiston @UCANR, and included Helene Dillard (UCDavis), Andy Thulin (CalPoly), Wendy Wintersteen (Iowa State). Key discussion points included lack of food system transparency, science communication and literacy, making money with organics, education and training, farm sustainability and efficiency, market segmentation (e.g. organics), downstream processing, and consumer power to change food systems. Plus the Amazon purchase of Whole Foods.

The Tech-Enabled Consumer session featured 4 speakers from companies who feature tech around food. Katie Finnegan from Walmart, David McIntyre from Airbnb, Barbara Shpizner from Mattson, Michael Wolf from The Spoon. Pretty neat discussion around the way these diverse companies use tech to customize customer experience, provide cost savings, source food, contribute to a better food system. 40% of food waste is in homes, another 40% is in the consumer arena. So much to be done!

The session on Downstream Impacts for the Food Production System featured Chris Chochran from ReFed @refed_nowaste, Sabrina Mutukisna from The Town Kitchen @TheTownKitchen, Kevin Sanchez from the Yolo Food Bank @YoloFoodBank, and Justin Siegel from UC Davis International Innovation and Health. We talked about nutrition for all, schemes for minimizing food waste, waste streams, food banks, distribution of produce and protein to those who need them (@refed_nowaste and @YoloFoodBank), creating high quality jobs for young people of color in the food business (@TheTownKitchen), the amount of energy that is involved in the food system (David Lee from ARPA-E); this means 7% of our energy use in the US inadvertently goes to CREATING FOOD WASTE. Yikes!

The session on Upstream Production Impacts from New Consumer Food Choices featured Ally DeArman from Food Craft Institute @FoodCraftInst, Micke Macrie from Land O' Lakes, Nolan Paul from Driscoll's @driscollsberry, and Kenneth Zuckerberg from Rabobank @Rabobank. This session got cut a bit short, but it was pretty interesting. Especially the Food Craft Institute, whose mission is to help "the small guys" succeed in the food space.

The afternoon sessions included some pitch competitions, deep dive breakouts and networking sessions. What a great day for ANR.

Croudsourced view of global agriculture: mapping farm size around the world

From Live Science. Two new maps released Jan. 16 considerably improve estimates of the amount of land farmed in the world — one map reveals the world's agricultural lands to a resolution of 1 kilometer, and the other provides the first look at the sizes of the fields being used for agriculture.

The researchers built the cropland database by combining information from several sources, such as satellite images, regional maps, video and geotagged photos, which were shared with them by groups around the world. Combining all that information would be an almost-impossible task for a handful of scientists to take on, so the team turned the project into a crowdsourced, online game. Volunteers logged into "Cropland Capture" on a computer or a phone and determined whether an image contained cropland or not. Participants were entered into weekly prize drawings.

Berkeley Food Institute's new grants announced

The new Berkeley Food Institute has released its crop of funded projects from its first seed grant program. Our project Making the Road by Mapping: Informing Food System Transformation through Participatory Mapmaking was selected for seed funding. This project, led by Kathryn DeMaster includes graduate students Adam Calo (ESPM) and Sarah Van Wart (Information), Darin Jensen (Geography), Tapan Parikh (Information), Kaley Grimland-Mendoza (Agriculture and Land-Based Training Association), Amber Sciligo (Post-doc, ESPM), Christy Getz (ESPM), and Jennifer Sowerwine (Jepson Herbaria). We look forward to digging in.

Our participatory mapping research project has four primary purposes: First, we explore participatory mapping as a way to collaboratively generate new food system knowledge with scholars, practitioners, and producers. Second, through a process we term “communitysourcing,” we aim to illuminate overlooked caches of community-based knowledge and engage community members, agricultural producers and scholars in collaborative efforts to map a particular food system supply chain (small-scale organic strawberry production in the Salinas Valley). Third, we aim to integrate the interdisciplinary community-based participatory research with specific understandings of the way that certain agricultural policies either facilitate or restrict sustainable small-scale organic strawberry production in the Salinas Valley (with a particular focus on water quality and food safety policy/regulations). Fourth, we will present our findings in novel, innovative, and visually captivating ways that will: (a) Inform specific policies/regulations and; (b) Provide small-scale producers with easily accessible caches of community generated knowledge to inform their practices.

http://berkeleyfoodinstitute.org/current-research/

Barbara Laraia talks about links between stress, food and obesity

Our colleague Barbara Laraia was recently interviewed by PBS newshour on her work linking stress and obesity in children. Barbara is the lead on our OurSpace project, in which Sam and Paulina and others are examining the interaction between food availability, walkability and health outcomes.

A very interesting interview: http://www.pbs.org/newshour/rundown/2014/01/why-stress-and-money-woes-may-lead-to-weight-gain.html

Help to Validate Global Land Cover with GeoWiki and Cropland Capture

Courtesy of the International Institute for Applied Systems Analysis

This creative project from GeoWiki seeks to get croudsourced feedback on crop types from participants around the world. They say: 

By 2050 we will need to feed more than 2 billion additional people on the Earth. By playing Cropland Capture, you will help us to improve basic information about where cropland is located on the Earth's surface. Using this information, we will be better equipped at tackling problems of future food security and the effects of climate change on future food supply. Get involved and contribute to a good cause! Help us to identify cropland area!

Oh yeah, and there are prizes!

Each week (starting Nov. 15th) the top three players with the highest score at the end of each week will be added to our weekly winners list. After 25 weeks, three people will be drawn randomly from this list to become our overall winners. Prizes will include an Amazon Kindle, a brand new smartphone and a tablet.

Happy Thanksgiving everyone!

Range map of our friend Meleagris gallopovaThe ancestor all present-day gobblers—Meleagris gallopova - ranged from southeastern Canada to Mexico. 

Our present-day wild turkey has a loud call, with descending gobbles, and a variety of clucking notes. He struts through open woodlands, oaks, edges, and the occasional suburb.

The Wild Turkey’s popularity at the table led to a drastic decline in numbers, but they have recovered and now occur in every state except Alaska.

I think Ben Franklin said it best, in comparing the turkey to the eagle:

For in Truth the Turk'y is in comparison a much more respectable bird, and withal a true original native of America.... He is, (though a little vain and silly, it is true, but not the worse emblem for that,) a Bird of Courage, and would not hesitate to attack a grenadier of the British Guards, who should presume to invade his Farm Yard with a red Coat on.

Happy Thanksgiving Everyone!

Information from A Short History of the Turkey by the Collonial Williamsburg Newsletter, and BirdFellow.com.

Food: An Atlas by Guerrilla Cartographers is ready for your support!

An atlas of food: a cooperatively-created, crowd-sourced and crowd-funded project of guerrilla cartography and publishing. Check it out! Food: An Atlas is ready to roll. Check out the promo at kickstarter and consider supporting the project.

5 months
+ 80 collaborating cartographers and researchers
+ 8 volunteer editors
+ An abundance of volunteer campaign wranglers, academics, designers, and artists
+ You
= Food: An Atlas

Philadelphia food desert eradication project

Here is a recent article from the Washington Post examining Philadelphia's Get Healthy Philly initiative. $900,000 from the project is going to be spent on turning 632 corner stores in the city into green grocers. The effort helps these corner stores buy and supply fresh fruits and vegetables and buy the infrastructure needed to store them, such as refrigerators.

This effort goes in hand with a new study in the city that will examine what happens when more nutritious foods are introduced into traditionally underserved neighborhoods. Measuring what people bought before, what they’re eating now, and how health outcomes change. The article also explores other research on food deserts, access to healthy foods, and health outcomes with lessons learned.

For the full article click here.

Farm surveillance for subsidy checking: the case in Europe

Europe's farmers receive payments for maintaining basic standards on the environment, food safety, plant health and animal welfare. In this BBC article "spying on Europe’s farms with satellites and drones" Lawrence Peter discusses the use of UAVs in conjunction with satellite imagery to validate and verify farmers' subsidies without having to send inspectors in person. They are not used everywhere: Austria does not use them, on the grounds that the shadows cast by very mountainous terrain sometimes make satellite images inaccurate. And Scotland, unlike the rest of the UK, decided against satellites because of the difficulty of getting enough clear weather for flyovers.

Notes: 

  • Agriculture accounted for 42% of the EU's budget in 2011 - about three-quarters of that went on direct payments to farmers, totalling 44bn euros (£37bn; $58bn)
  • In each EU country, at least 5% of farms must be inspected every year - and many check more than 5%
  • Satellites carried out about 70% of all inspections in 2010
  • Growth of satellite monitoring has cut number of infringements
  • EU officials say fraud accounts for only a small fraction of the irregularities - in most cases farmers overclaim because of a miscalculation

New evidence of indirect land use change from biofuel production in Brazil

Querência, in Mato Grosso, BrazilA new article in Environmental Research Letters “Statistical confirmation of indirect land use change in the Brazilian Amazon," looks at how mechanized agriculture in Brazil affects the country's forest in the Amazon, which is the second largest forest in the world. The article is authored by Marcelus Caldas, an assistant professor of geography at K-State, and colleagues Eugenio Arima from the University of Texas at Austin, and Peter Richards and Robert Walker from Michigan State University. Using data from 2003-2008, the team statistically linked the loss of forest area as the indirect effect of changing pastureland into space for soybean and biofuel crops in counties bordering the Amazon.

Marcelus Caldas, an assistant professor of geography at K-State says: "Between 2003-2008 soy production expanded in Brazil by 39,000 square kilometers. Of this 39,000 square kilometers, our study shows that reducing soybean production by 10 percent in these pasture areas could decrease deforestation in heavily forested counties of the Brazilian Amazon by almost 26,000 square kilometers -- or 40 percent."

The Brazilian government says soybean and sugarcane are grown largely in degraded pasture, but data from the team's spatial analysis work cascading impacts: many of these crops have crept into the Brazilian savanna, a large area bordering the Amazon that's used for cattle. Consequently, this has created deforestation in the savanna, driving cattle inside the Amazon.

"Our data shows that the Amazon now has 79 million heads of cattle," Caldas said. "Fifteen years ago, it had less than 10 million. That means that there's a problem with cattle moving inside the forest."

This could be exacerbated with increased global demand for food crops in Brazil. The tradeoffs between food, fuel and forest could continue to come down on the side of food and fuel, at the expense of forests.

More here. Official press release here.

ESRI Food Desert Mapping

Also from Greeninfo Network. Team ESRI, publisher of ArcGIS software, has rolled out “The Food Desert Finder” a terrific interactive map which shows where there are gaps in access to supermarkets.  If access to nutritious food is limited or made difficult by factors such as cost or the distance traveled to obtain it, peoples’ health suffers – these areas that lack relatively easy access to nutritious, affordable food as popularly known as “food deserts.”  The ESRI Food Desert Finder is a searchable map that shows populations in poverty who live beyond a one mile walk to a supermarket and who lack other access to healthy fresh foods.

Berkeley/Kensington area, CAHere is a snap from the Berkeley/Kensington area. Obviously, something more than just walking distance to supermarkets is critical, as the Kensigton area (showing all the red dots - indicating people without easy access to grocery stores) is not known as an underserved community. Still a very nice tool, and one which will be used by our OurSpace project.


UrbanFood.org released

This new internet map site from Nathan McClintock shows both existing urban gardens and vacant or open spaces in Oakland, CA where food could potentially be produced. Publicly owned land with productive potential totals 1,201 acres while private vacant land totals 848 acres. Food production at these sites could potentially produce as much as 15 to 20 percent of Oakland’s fruit and vegetable needs. Read the report on the website for details. This is such a great resource, and beautifully designed.

National Map of Food Deserts

I live in a Low Access Area! According to a new food desert webGIS, my neighobrhood around 58th & Shattuck doesn't have access to a full-service grocery store, has low car ownership, and low median household income. I have never considered my self to live in a food dessert because I go to Berkeley Bowl at least once a week on my bike ride home from campus, but according to these combined metrics I am more underserved by full-service food stores than most other neighborhoods. I think this is a really neat tool to start a broader conversation about how to measure and evaluate food access and what it means for individual and community health.

As Grist writes...."The point of the project isn't just to map food deserts, it's to help TRF and other investors, as well as policymakers, calculate how much money is "leaking" from an area (being spent elsewhere), so as to evaluate whether a loan for a new supermarket is a good idea -- financially, presumably. As Stephanie covered in her piece, food-justice advocates disagree on whether small, independently owned but somewhat limited food stores are the answer, or chain stores such as a Safeway or Walmart.

Alas, the tool does not include data for health care expenditures or obesity rates in these areas, which would be interesting comparisons to see."


Hot of the Presses! Field Guide to California Agriculture

Anyone who travels California's byways sees the many faces of agriculture. A huge entwined business, farming and ranching are the state's dominant land use. Yet few Californians understand what animals and crops are raised or how agriculture reflects our relationship with nature. This fascinating and gorgeously illustrated field guide gathers essential information about agriculture and its environmental context, and answers the perennial question posed by California travelers: “What is that, and why is it growing here?” Paul F. Starrs's lively text explores the full range of the state's agriculture, deftly balancing agribusiness triumphalism with the pride of boutique producers, sketching meanwhile the darker shadows that can envelop California farming. Documented with diverse maps and Peter Goin's insightful photographs, this book captures the industry's energy and ingenuity and its wildly diverse iconography, from the mysteries of forbidden crops (like marijuana) to the majesties of scale in food production.

Check it.

Food Environmental Atlas for the US

Example from the USDA food atlas: pounds per capita of solid fats eatenFood insecurity, diet choice, access to healthy foods: these vary greatly across communities in the US.  In order to visualize these patterns and stimulate research and discussion, the USDA has published an online food atlas.  The USDA Food Atlas currently includes 90 indicators of the food environment such as: store/restaurant proximity, food prices, food and nutrition assistance programs, and community characteristics—interact to influence food choices and diet quality. It is fairly course, but very illustrative of spatial pattern of food insecurity, diet, access to restaurants and fast food, and many other factors.  With this interactive atlas, you can:

  • Create maps showing the variation in a single indicator across the U.S.; for example, variation in the prevalence of obesity or access to grocery stores across U.S. counties. Check out this scary example above: pounds per capita of solid fats eaten (light green - low; dark blue high, up to 24 pounds);

  • View all of the county-level indicators for a selected county;

  • Use the advanced query tool to identify counties sharing the same degree of multiple indicators; for example, counties with both high poverty and high obesity rates;

  • Download data.

The Michelle Obama Bounce: Organic farms

Retail sales of organic produce have reached $20 billion; 5% of veggies sold are now organic; and 1% of milk comes from organic dairy farms. And Michael Pollan (on last week's forum program) says there is a new form of organic conservative calling themselves "crunchycons".  It is a new world.  To illuminate these trends, NYTimes' map department turns to organic farms, and produces these useful maps.

Pollan is at it again

By "it" I mean brilliantly explaining the food situation. Read his Open Letter to the Next President from Sunday's NYTimes; and listen to him on Fresh Air (10-20-08 podcast).  He touches on everything we talked about in lab meeting last week - ethanol, cheap calories, obesity, GHG, growing biofuels on prime agricultural land, farmer's disincentives to grow food. This guy is amazing.

Measuring Your Food Environment

This site is related to the work Ellen and I are working on with Barbara Laraia and Irene Yen at UCSF. We are mapping the food environment for a study collaborating with Kaiser examining obesity and diabetes rates.  This is a new-ish field, with lots of new and exciting methods being developed to map access to "good" and "bad" food.  The National Cancer Institute has developed a site that collects many of these approaches.