Philadelphia food desert eradication project

Here is a recent article from the Washington Post examining Philadelphia's Get Healthy Philly initiative. $900,000 from the project is going to be spent on turning 632 corner stores in the city into green grocers. The effort helps these corner stores buy and supply fresh fruits and vegetables and buy the infrastructure needed to store them, such as refrigerators.

This effort goes in hand with a new study in the city that will examine what happens when more nutritious foods are introduced into traditionally underserved neighborhoods. Measuring what people bought before, what they’re eating now, and how health outcomes change. The article also explores other research on food deserts, access to healthy foods, and health outcomes with lessons learned.

For the full article click here.

Tim De Chant explains why you should be excited about vector-based maps in iOS 6

Former kellylabber Tim De Chant has a nice piece on the upcoming apple mapping software for mobile devices:

Apple announced today that it’s revamping the Maps application on iOS devices—iPhone, iPad, iPod touch—introducing a lot of showy new features like turn-by-turn directions and 3D flyovers. While those make for sexy commercials, they won’t be as impactful as the switch from raster- to vector-based map data. If you’re not sure why you should be excited about the change—and you should be—read on.

Check out his blog post here.


Jonathan Crowe (formerly of The Map Room, now of "My Correct Views on Everything") has a comprehensive post on the subject here.

Apple mobile mapping software? coming soon!

We mac users are all a-twitter about the news of an impending Apple mapping software. Here is a sample from NPR:

There's been speculation for months that Apple will try to elbow Google's popular Maps app aside on the iPhone and unveil its own map app, and some of the best evidence yet comes from Tuesday's Wall Street Journal.  The paper looked into the reasons for the impending switch and the broader implications it would have for the smartphone market.  The article continues...

The new software is rumored to be leaner, meaner, and packing a rad 3D visualization capability. It will be unveiled as soon as next week at the annual Apple developer conference in San Francisco.

SNAMP feature in Cal Ag

A nice article about SNAMP is now in the recent version of California Agriculture.  In the same edition is a great series of articles about the 150 anniversary of the Morrill Land-Grant College Act which made higher education available to those in every social class, and brought practical information to a nation that was then more than 50% farmers. Cooperative Extension was born with this Act, and it continues to evolve today. A summary by Janet L. White is here.

California Agriculture 66(2):39-39. DOI: 10.3733/ca.v066n02p39a. April-June 2012.

In 1862, in a nation torn by secession and Civil War, President Abraham Lincoln signed a visionary law that laid the cornerstone of public higher education. The Morrill Land-Grant College Act gave federal public lands to states, allotting 30,000 acres for each Senator and Representative. The total endowment was $7.55 million, then the value of 17.4 million acres. Today, more than 100 land-grant universities serve the nation and the world, including what many believe is the greatest public university in the world, the University of California.

On the 150th anniversary of its passage, we pay tribute to this profoundly democratic law, which made higher education available to those in every social class, and brought practical information to a nation that was then more than 50% farmers. It was followed by other landmark education laws: the 1887 Hatch Act, establishing Agricultural Experiment Stations at universities; a second Morrill Act in 1890, initiating regular funding; the Smith-Lever Act of 1914, establishing Cooperative Extension; and in 1944, the GI Bill. Today, UC's land-grant university thrives as the Agricultural Experiment Stations at UC Berkeley, Davis and Riverside, and in UC Cooperative Extension offices that serve every county.

See see pages 40 to 49 for special coverage of the Morrill Act and its role in building the University of California.

Livehoods: Dynamic maps of place via social networking

Livehoods is an interesting research project from the School of Computer Science at Carnegie Mellon University which maps social networking activity and patterns using tweets and check-ins to examine the hidden structure of cities and neighborhoods. For example below on the map each point represents a check-in location. Groups of nearby points of the same color represent a Livehood. Within a Livehood statistics are calculated aggregating check-ins overtime and depicts how a place is used. For more information on Livehoods click here.

Livehoods Screenshot

cal-adapt article in new BAAMA journal

cal-adapt.org is featured in the Spring 2012 BAAMA journal. In an article led by Kevin and Brian, new tools in the cal-adapt.org website are highlighted. For example, one of the most serious threats to the public health of Californians are extreme heat events. Climate models, developed by the Scripps Institution of Oceanography, project that extreme heat events will increase in frequency, intensity, and duration given future climate change. Cal-adapt.org shows future projected number of heat waves, timing of extreme heat days, maximum duration of heat waves, and daily high temperatures. Check out the new tools here.

Report on the April 19 Careers in GIS event at UC Berkeley

GIS @ Berkeley

Careers in GIS

On April 19 the College of Natural Resources and the College of Environmental Design held an informative workshop on Careers in GIS.  This workshop covered many aspects of Geographic Information Sciences: resources on the Berkeley campus, options for the new Minor in Geographic Information Science and Technology, and highlighted areas of GIS research.  Over 40 people attended, and we had a lively program, including a welcome from Jennifer Wolch (Dean of CED), Doug Richardson (Executive Director of the AAG), Maggi Kelly (Professor in ESPM); Scott Stephens (Professor in ESPM) talked about his work using GIS and spatial data for forest fire modeling, Mei-Po Kwan (Visiting Professor in Geography) discussed GIS Analysis for transportation and health studies, highlighting some of her fascinating work in spatial-temporal analysis of human movement; and Paul Waddell (Professor in CRP) showed highlights of his GIS and urban mapping, including UrbanSim, a very novel open source approach to city planning and accessibility studies. In addition, Jon Ridener from the Earth Sciences and Map Library discussed the GeoData@UCBerkeley, a GIS data portal and repository created by the UC Berkeley Library. Wow! All great stuff.

The event was brought to you by: College of Natural Resources, College of Environmental Design, Geospatial Innovation Facility. For more information on GIS at Berkeley, please see the GIS @ Berkeley website.

New high resolution coastal elevation data for California

The California Ocean Protection Council has released state-wide high resolution elevation data for coastal California and much of San Francisco Bay. LiDAR data were collected between 2009-2011 and cover nearly 3,800 square miles. Data can be download from NOAA Coastal Services Center's Digital Coast website:

Follow up on Supreme Court gps+privacy case

From the NYTimes. Police Are Using Phone Tracking as a Routine Tool. By Published: March 31, 2012.

Law enforcement tracking of cellphones, once the province mainly of federal agents, has become a powerful and widely used surveillance tool for local police officials, with hundreds of departments, large and small, often using it aggressively with little or no court oversight, documents show.

A GPS tracker. The Supreme Court recently ruled that such a device placed on a suspect's car was an unreasonable search.

The Supreme Court recently ruled that such a device placed on a suspect's car was an unreasonable search (but sidestepepd the question of how to treat information gathered from devices installed by the manufacturer and how to treat information held by third parties like cellphone companies). The practice has become big business for cellphone companies, too, with a handful of carriers marketing a catalog of “surveillance fees” to police departments to determine a suspect’s location, trace phone calls and texts or provide other services. Some departments log dozens of traces a month for both emergencies and routine investigations.

With cellphones ubiquitous, the police call phone tracing a valuable weapon in emergencies like child abductions and suicide calls and investigations in drug cases and murders. One police training manual describes cellphones as “the virtual biographer of our daily activities,” providing a hunting ground for learning contacts and travels.


Lidar + OPALs geolunch and workshop next week!

Full waveform lidarOur colleague Bernhard Hofle from the University of Heidelberg will be here next week as part of an international exchange project: Airborne Laser Scanning for 3D Vegetation Characterization: Set-up of an International Signature Database. Bernhard is interested in Open Source GI and Spatial Database Management Systems, Object-based image and point cloud analysis, radiometric calibration of full-waveform airborne LiDAR data, and other topics.

Bernhard is part of a group that now has one of the first Terrestrial Laser Scanning (TLS) systems worldwide with full-waveform recording capability (upgraded Riegl VZ-400). Deeper understanding and substantially improved analysis of the laser shot backscatter of natural objects by having direct access to full-waveform signatures and physical observables are expected. The unique system will be applied in new research projects dealing with the extraction of 3D geoinformation in e.g. precision farming, geoarchaelogy, geomorphology and forestry. Furthermore, an extensive web-based database of reference signatures for known objects will be developed based on calibrated waveform features derived by TLS.

He is a leader in analysis of discrete and waveform lidar data in urban and forest applications and one of the developers of the cool OPALS lidar software. He'll be giving a geolunch and a workshop afterwards on the software. The geolunch is 1-2, then we will stick around and learn about OPALS.

New Perpetual Ocean and Wind Map Animations

Two interesting natural phenomena spatial animations were recently released. The first is from NASA which visualizes ocean surface currents around the world from 2005 to 2007. The animations were generated from data modeled using NASA’s Estimating the Circulation and Climate of the Ocean, Phase II also known as ECCO2. For more information click here. See the video below:

The second is from HINT.FM which visualizes near real time wind movement patterns in the US using data from the National Digital Forecast Database. To see the animation click here. Here is a static screenshot from their website:

HINT.FM Wind Map

ASPRS 2012 Wrap-up

ASPRS 2012, held in Sacramento California, had about 1,100 participants. I am back to being bullish about our organization, as I now recognize that ASPRS is the only place in geospatial sciences where members of government, industry, and academia can meet, discuss, and network in a meaningful way. I saw a number of great talks, met with some energetic and informative industry reps, and got to catch up with old friends. Some highlights: Wednesday's Keynote speaker was David Thau from Google Earth Engine whose talk "Terapixels for Everyone" was designed to showcase the ways in which the public's awareness of imagery, and their ability to interact with geospatial data, are increasing. He calls this phenomena (and GEE plays a big role here): "geo-literacy for all", and discussed new technologies for data/imagery acquisition, processing, and dissemination to a broad public(s) that can include policy makers, land managers, and scientists. USGS's Ken Hudnut was Thursday's Keynote, and he had a sobering message about California earthquakes, and the need (and use) of geospatial intelligence in disaster preparedness.

Berkeley was well represented: Kevin and Brian from the GIF gave a great workshop on open source web, Kevin presented new developments in cal-adapt, Lisa and Iryna presented chapters from their respective dissertations, both relating to wetlands, and our SNAMP lidar session with Sam, Marek, and Feng (with Wenkai and Jacob from UCMerced) was just great!

So, what is in the future for remote sensing/geospatial analysis as told at ASPRS 2012? Here are some highlights:

  • Cloud computing, massive datasets, data/imagery fusion are everywhere, but principles in basic photogrammetry should still comes into play;
  • We saw neat examples of scientific visualization, including smooth rendering across scales, fast transformations, and immersive web;
  • Evolving, scaleable algorithms for regional or global classification and/or change detection; for real-time results rendering with interactive (on-the-fly) algorithm parameter adjustment; and often involving open source, machine learning;
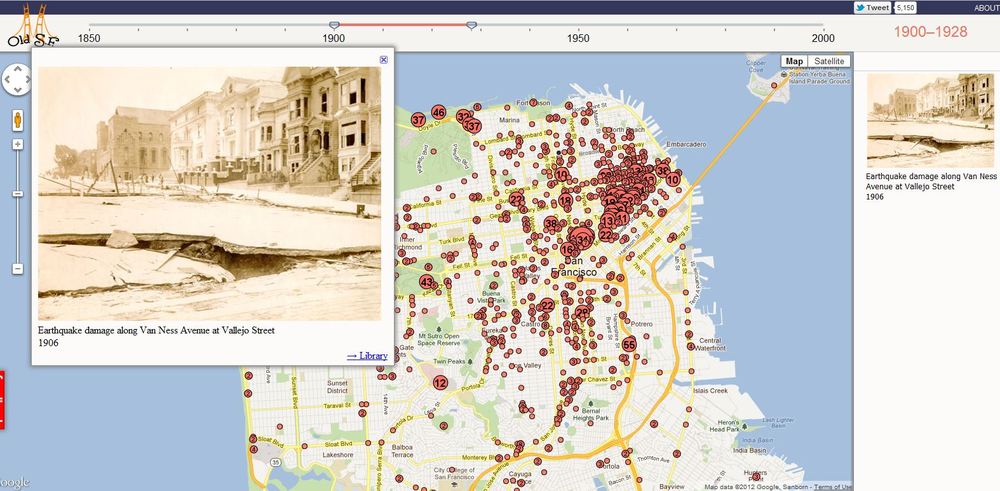
  • Geospatial data and analysis are heavily, but inconsistently, deployed throughout the US for disaster response;
  • Landsat 8 goes up in January (party anyone?) and USGS/NASA are looking for other novel parterships to extend the Landsat lifespan beyond that;
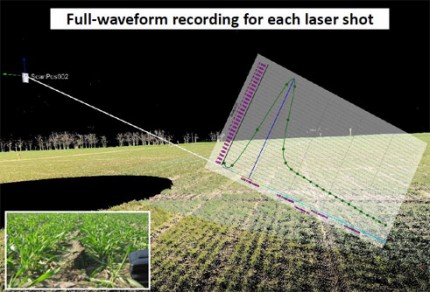
  • Lidar is still big: with new deployable and cheaper sensors like FLASH lidar on the one hand, and increasing point density on the other;
  • Obia, obia, obia! We organized a nice series of obia talks, and saw some great presentations on accuracy, lidar+optical fusion, object movements; but thorny issues about segmentation accuracy and object ontology remain; 
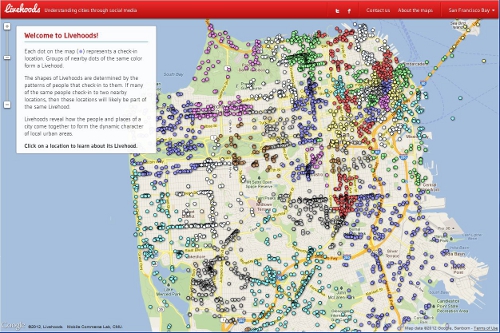
  • Public interaction with imagery and data are critical. The Public can be a broader scientific community, or a an informed and engaged community who can presumably use these types of data to support public policy engagement, disaster preparedness and response.

AAG 2012 Wrap-up

NY skyline from Tim DeChant's blogAAG was a moderately large conference (just under 9,000) this year, held in mid-town NY. It was a brief trip for me, but I did go to some great talks across RS, GIScience, cartography, and VGI. I also went to a very productive OpenGeoSuite workshop hosted by OpenGeo. Some brief highights from the conference: Muki Hacklay discussed participation inequities in VGI: when you mine geoweb data, you are mining outliers, not society; there are biases in gender, education, age and enthusiasm. Agent-based modeling is still hot, and still improving. I saw some great talks in ABM for understanding land use change. Peter Deadman showed how new markets in a hot crop (like Acai) can transform a region quite quickly. Landsat 8 will likely be launched in early 2013, but further missions are less certain. My talk was in a historical ecology session, and Qinghua Guo and I highlighted some of the new modeled results of historic oak diversity in California using VTM data and Maxent.

Saturday evening I had the great pleasure of being locked in after hours at the NY Public Library for a session on historic maps. David Rumsey, with Humphrey Southall (University of Portsmouth) and Petr Pridal (Moravian Library) led a presentation introducing a new website: oldmapsonline.org. The website's goal is to provide a clearer way to find old maps, and provide them with a stable digital reference. 

New Map Tool and Widgets: What’s Your Coastal Flood Risk?

This new interactive website SurgingSeas, a project of Climate Central, lets you see the combined coastal flood threat from sea level rise and storm surge, town by town and city by city from coast to coast. Type in your Zip code or the name of your community, choose a water level anywhere from 1 to 10 feet above the current high-tide line, and you can see what areas might be at risk of flooding from water that high. You can also go to any one of 55 tide gauges we studied around the country, and see the odds we’ve calculated for how soon flood waters may reach different elevations as the sea continues to rise. There are gauges close to most major coastal cities. If you want to embed the map in your own blog or website, there’s a widget for that, and you can make any view your default — not just the national one. - Michael D. Lemonick

Minor in GIS @ Berkeley

Great news!! The Minor in Geospatial Information Science and Technology has been approved in 2 departments at UC Berkeley!  Environmental Science, Policy and Management (in the College of Natural Resources), and the Department of City and Regional Planning in the College of Environmental Design now have Minors in Geospatial Information Science and Technology and includes courses across campus. These programs would serve students in geography and other social sciences, archeology, environmental science, policy and management, city and regional planning, humanities, architecture, landscape architecture and environmental planning, civil and environmental engineering, public policy, and environmental public health. The Minor will help prepare graduates for a workplace in public and private sectors with increasing need for geospatial expertise. In 2010, the Dept. of Labor's Employment and Training Administration (ETA) tagged Geospatial Technologies as a "High Growth Industry". The Minor is open to all majors at UC Berkeley.

Please see GIS@Berkeley for more info.