SPUR 2021 update: Mapping changes to police spending in California

The Fall 2020 UC Berkeley’s Rausser College of Natural Resources Sponsored Project for Undergraduate Research (SPUR) project “Mapping municipal funding for police in California” continued in Spring 2021 with the Kellylab. This semester we continued our work with Mapping Black California (MBC), the Southern California-based collective that incorporates technology, data, geography, and place-based study to better understand and connect African American communities in California. Ben Satzman, lead in the Fall, was joined by Rezahn Abraha. Together they dug into the data, found additional datasets that helped us understand the changes in police funding from 2014 to 2019 in California and were able to dig into the variability of police spending across the state. Read more below, and here is the Spring 2021 Story Map: How Do California Cities Spend Money on Policing? Mapping the variability of police spending from 2014-2019 in 476 California Cities.
This semester we again met weekly and used data from 476 cities across California detailing municipal police funding in 2014 and 2019. By way of background, California has nearly 500 incorporated cities and most municipalities have their own police departments and create an annual budget determining what percentage their police department will receive. The variability in police spending across the state is quite surprising. This is what we dug into in Fall 2020. In 2019 the average percentage of municipal budgets spent on policing is about 20%, and while some municipalities spent less than 5% of their budgets on policing, others allocated more than half of their budgets to their police departments. Per capita police spending is on average about $500, but varies largely from about $10 to well over $2,000. Check out the Fall 2020 Story Map.

This semester, we set out to see how police department spending changed from 2014 to 2019, especially in relation to population changes from that same 5-year interval. We used the California State Controller's Finance Data to find each city's total expenditures and police department expenditures from 2014 and 2019. This dataset also had information about each city's total population for these given years. We also used a feature class provided by CalTrans that had city boundary GIS data for all incorporated municipalities in California.

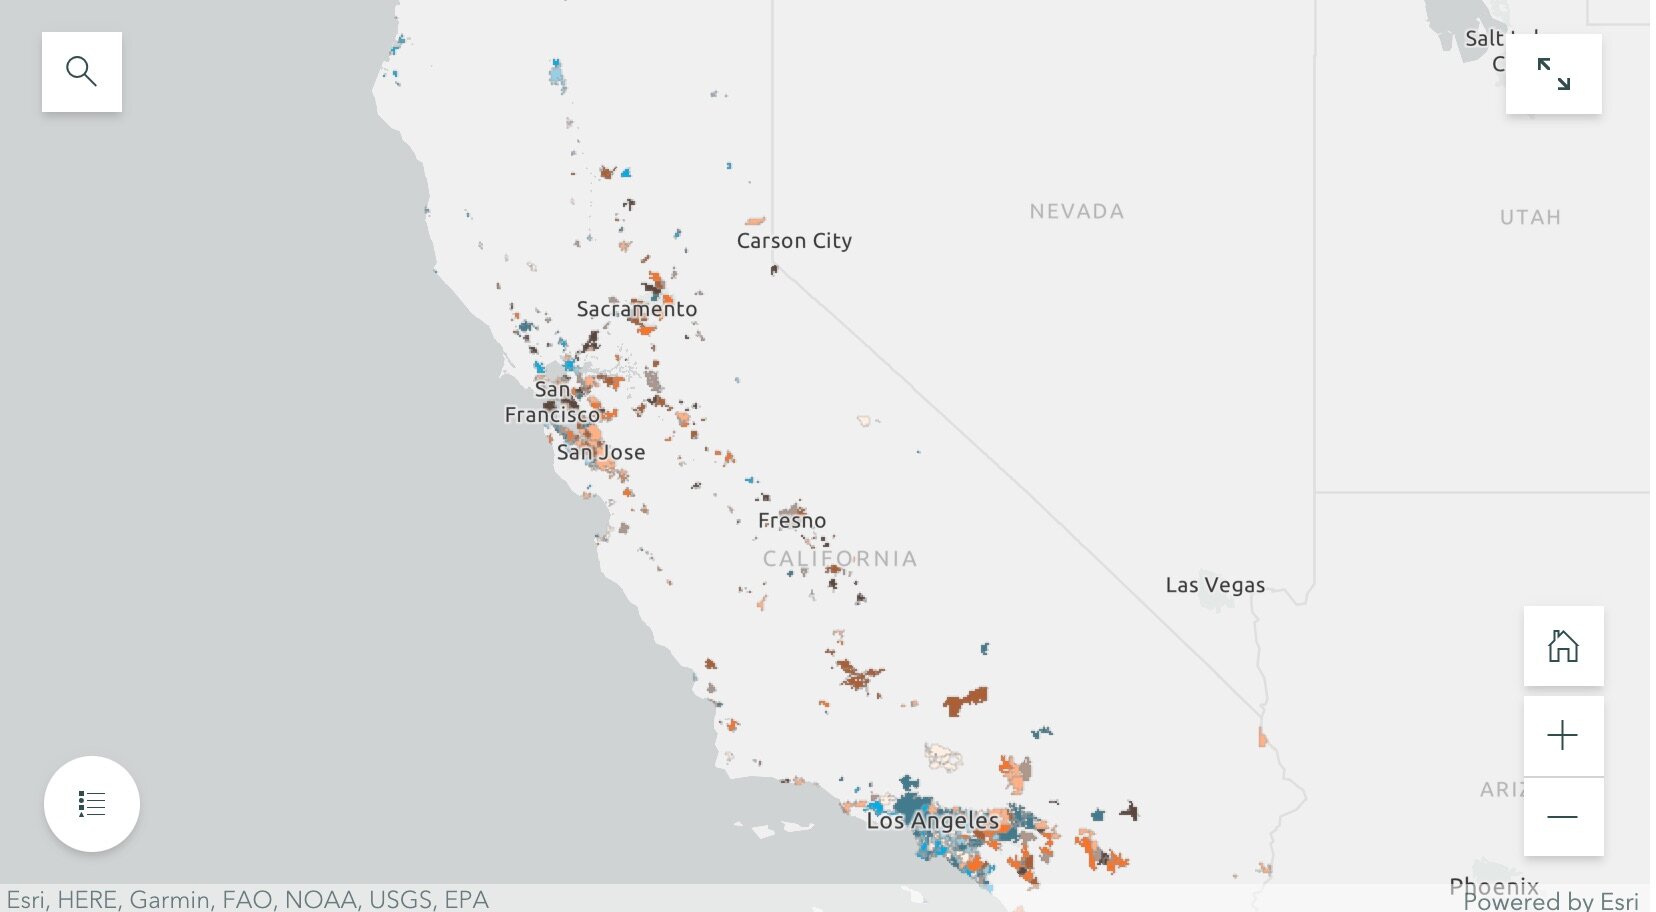
By dividing the police department expenditures by the total city expenditures for both 2014 and 2019, we were able to create a map showing what percentage of their municipal budgets 476 California cities were spending on policing. We were also able to visualize the percentage change in percentage police department spending and population from 2014 to 2019. Changes in police spending (and population change) were not at all consistent across the state. For example, cities that grew sometimes increased spending, but sometimes did not. Ben and Rezahn came up with a useful way of visualizing how police spending and population change co-vary (click on the map above to go to the site), and found 4 distinct trends in the cities examined:

SPUR2021.jpg
  • Cities that increased police department (PD) spending, but saw almost no change in population (these are colored bright blue in the map);

  • Cities that saw increases in population, but experienced little or negative change in PD spending (these are bright orange in the map);

  • Cities that saw increases in both PD spending and population (these are dark brown in the map); and

  • Cities that saw little or negative change in both PD spending and population (these are cream in the map).

They then dug into southern California and the Bay Area, and selected mid-size cities that exemplified the four trends to tell more detailed stories. These included for the Bay Area: Vallejo (increased police department (PD) spending, but saw almost no change in population), San Ramon (increases in population, but experienced little or negative change in PD spending), San Francisco (increases in both PD spending and population) and South San Francisco (little or negative change in both PD spending and population); and for southern California: Inglewood (increased police department (PD) spending, but saw almost no change in population), Irvine (increases in population, but experienced little or negative change in PD spending), Palm Desert (increases in both PD spending and population), Simi Valley (little or negative change in both PD spending and population). Check out the full Story Map here, and read more about these individual cities.

The 5-year changes in municipal police department spending are challenging to predict. Cities with high population growth from 2014 to 2019 did not consistently increase percentage police department spending. Similarly, cities that experienced low or even negative population growths varied dramatically in percentage change police department spending. The maps of annual police department spending percentages and 5-year relationships allowed us to identify these complexities, and will be an important source of future exploration.

The analysts on the project were Rezahn Abraha, a UC Berkeley Society and Environment Major, and Ben Satzman, a UC Berkeley Conservation and Resource Studies Major with minors in Sustainable Environmental Design and GIS. Both worked in collaboration with MBC and the Kellylab to find, clean, visualize, and analyze statewide data. Personnel involved in the project are: from Mapping Black California - Candice Mays (Partnership Lead), Paulette Brown-Hinds (Director), Stephanie Williams (Exec Editor, Content Lead), and Chuck Bibbs (Maps and Data Lead); from the Kellylab: Maggi Kelly (Professor and CE Specialist), Chippie Kislik (Graduate Student), Christine Wilkinson (Graduate Student), and Annie Taylor (Graduate Student).

We thank the Rausser College of Natural Resources who funded this effort.

Fall 2020 Story Map: Mapping Police Spending in California Cities. Examine Southern California and the Bay Area in detail, check out a few interesting cities, or search for a city and click on it to see just how much they spent on policing in 2017. 

Spring 2021 Story Map: How Do California Cities Spend Money on Policing? Mapping the variability of police spending from 2014-2019 in 476 California Cities.
SPUR2020 Update: Mapping Police Budgets in California

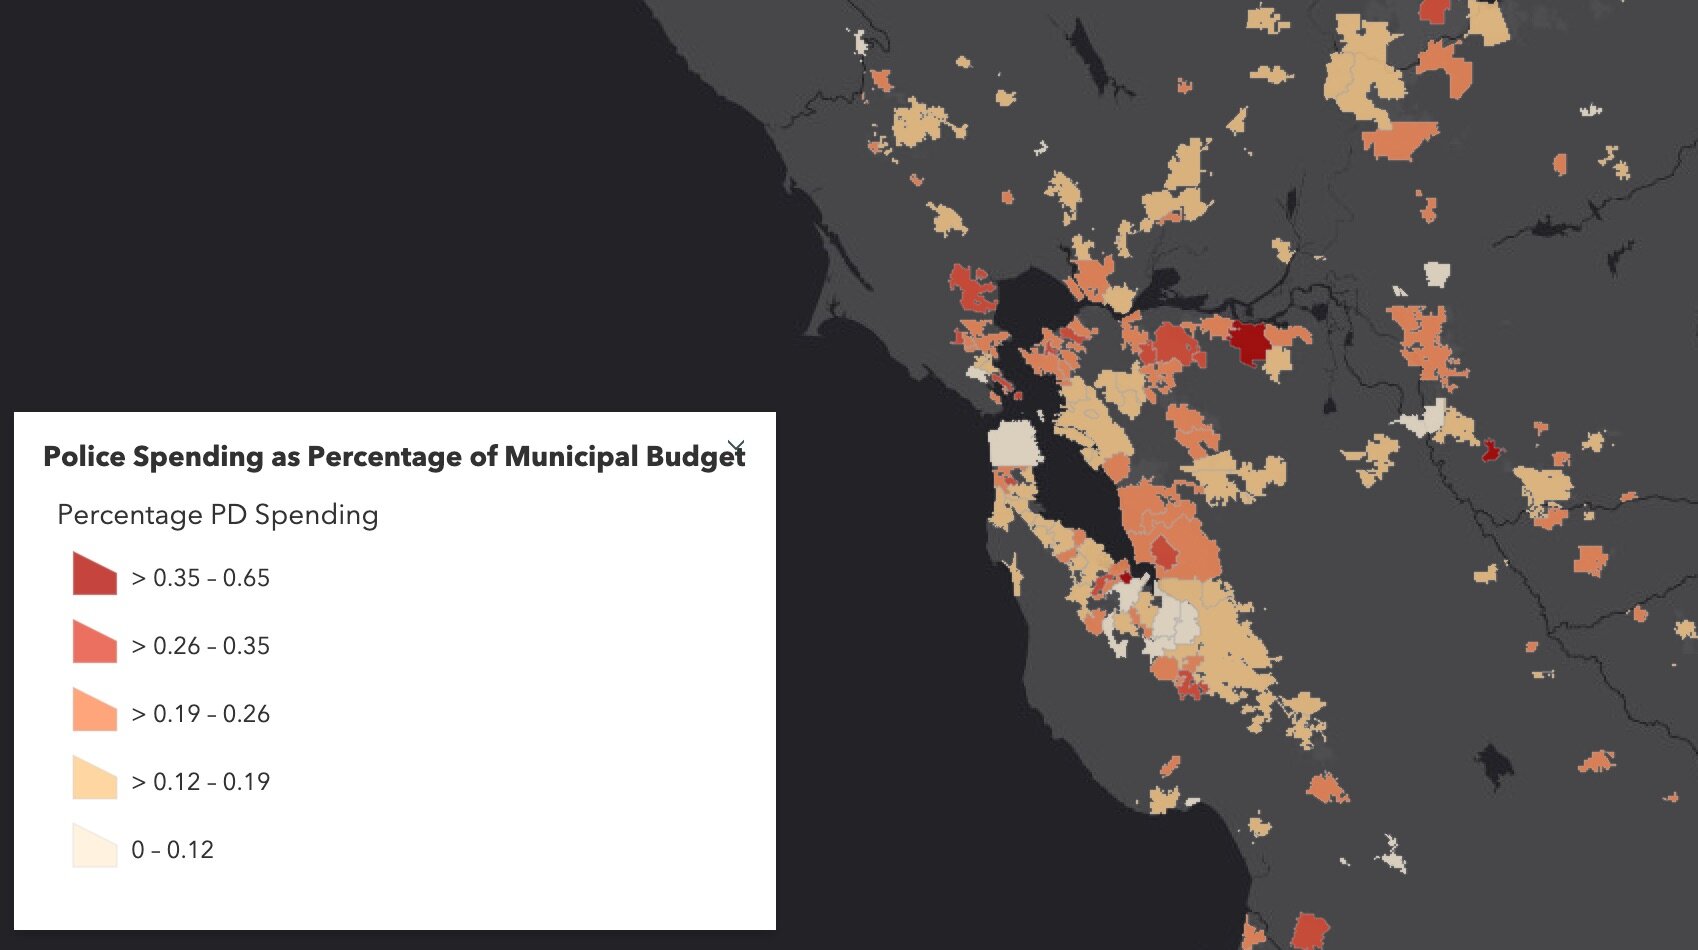
In September 2020, UC Berkeley’s Rausser College of Natural Resources selected the Kellylab for a Sponsored Project for Undergraduate Research (SPUR) project for their proposal entitled “Mapping municipal funding for police in California.” The project partnered with Mapping Black California (MBC), the Southern California-based collective that incorporates technology, data, geography, and place-based study to better understand and connect African American communities in California. We met weekly during the fall semester and gathered data from 472 cities across California, detailing the per-capita police funding and percent of municipal budget that is spent on police departments. California has nearly 500 incorporated cities and most municipalities have their own police departments and create an annual budget determining what percentage their police department will receive. The variability in police spending across the state is quite surprising - check out the figures below. The average percentage of municipal budgets spent on policing is about 20%, and while some municipalities spent less than 5% of their budgets on policing, others allocated more than half of their budgets to their police departments. Per capita police spending is on average about $500, but varies largely from about $10 to well over $2,000. If you are interested in this project, explore our findings through the Story Map: examine Southern California and the Bay Area in detail, check out a few interesting cities, or search for a city and click on it to see just how much they spent on policing in 2017. 

Figure showing variability in Police Spending (% of municipal budget) in Northern California in 2017. Data from California State Controller's Cities Finances Data, 2017 (City and police spending information). For more information see the Story Map h…

Figure showing variability in Police Spending (% of municipal budget) in Northern California in 2017. Data from California State Controller's Cities Finances Data, 2017 (City and police spending information). For more information see the Story Map here

Figure showing variability in Police Spending (PEr capita) in Northern California in 2017. Data from California State Controller's Cities Finances Data, 2017 (City and police spending information). For more information see the Story Map here. 

Figure showing variability in Police Spending (PEr capita) in Northern California in 2017. Data from California State Controller's Cities Finances Data, 2017 (City and police spending information). For more information see the Story Map here

The analyst on the project has been Ben Satzman, a UC Berkeley Conservation and Resource Studies Major with minors in Sustainable Environmental Design and GIS, who worked in collaboration with MBC and the Kellylab to find, clean, visualize, and analyze statewide data. We plan on continuing the project to explore the possible influences (such as racial diversity, crime, poverty, ethnicity, income, and education) underlying these regional trends and patterns in police spending. Personnel involved in the project are: from Mapping Black California - Candice Mays (Partnership Lead), Paulette Brown-Hinds (Director), Stephanie Williams (Exec Editor, Content Lead), and Chuck Bibbs (Maps and Data Lead); from the Kellylab: Maggi Kelly (Professor and CE Specialist), Chippie Kislik (Graduate Student), Christine Wilkinson (Graduate Student), and Annie Taylor (Graduate Student).

We thank the Rausser College of Natural Resources who funded this effort.

ESRI UC 2020 - Virtually. Day 1

My usual update from ESRI UC is a bit tougher this year, since I am working from home, and on one screen. So note taking is a bit rough. And I kind of miss the whole razz-ma-tazz of Day 1 on site. But here goes:

OK, so Jack’s Plenary is the always place to get a big view of new releases in software. 2020 is no different. A sweep of the software improvements coming this summer. Here is my (very) quick summary of highlights. Items with ‘*’ are those that will be useful in class (I hope).

The Conference Theme is Collaboration

What’s coming in ArcGIS Pro and AGOL: 

Data:

  • New layers

  • Better integration with OSM*

Visualization (New Map Apps* - launching this fall):

  • Beta now in AGOL

  • Better styling, better color ramps, and better dynamic interaction with color ramp *

  • Dot density mapping!

  • Clustering and new labeling

  • Filtering data

  • Some cool color blending as an alternative to transparency! *

Cartography in Pro:

  • Charts 

Story Maps

  • Optimize for mobile

  • Collections

  • StoryTeller role

Spatial Analytics and Data Science

  • New suitability modeling tool *

  • Spider diagrams

  • Modeling

  • AI, Big Data, ML

  • Jupyter Notebooks inside of ArcGIS Pro *

  • AGOL implementing Jupyter Notebooks

Imagery and Remote Sensing

  • Image management - ready to use workflows and content

  • Feature extraction

  • Analytics - classification, etc. 

  • Something called “Excalibur” - web-based exploitation. Search and find, feature extraction, add to a database

  • Drone Mapping *

    • Drone2Map on desktop

    • Site Scan - cloud-based solutions

3D Mapping

  • Jack loves voxels

Real-time Analytics

  • Cloud-based sensor data storage and management

Data Management

  • Improving editing: 2D and 3D editing improvements *

Field Maps App

  • In beta, and should streamline things. 

And Enterprise runs on kubernetes…

All leading up to ArcGIS 2021 next year.

OK deep breath, off for a lunch break. 

The Why, How, What, and Who of GIS Fall 2017

Every fall I ask my GIS students to answer the big questions in advance of their class projects. This year climate change, wildlife conservation, land use and water quality are important, as well as a number of other topics. Remote sensing continues to be important to GISers. Scientists, government and communities need to work together to solve problems. 

Why? 

  • What does the proposed project hope to accomplish?
  • What is the problem that needs to be addressed?
  • What do you expect to happen?

How? 

  • What analysis approach will be used?
  • Why was this approach selected?
  • What are alternative methods?
  • Is the analysis reproducible?

What?

  • What are the datasets that are needed?
  • Where will they come from?
  • Have you downloaded and checked this dataset?
  • Do you have a backup dataset?

Who?

  • Who will care about this? And why?
  • How will they use the results?
  • Will they be involved in the entire workflow?

Here are the responses from Fall 2017:

Distillation from the NEON Data Institute

So much to learn! Here is my distillation of the main take-homes from last week. 

Notes about the workshop in general:

NEON data and resources:

Other misc. tools:

Day 1 Wrap Up
Day 2 Wrap Up 
Day 3 Wrap Up
Day 4 Wrap Up

Day 2 Wrap Up from the NEON Data Institute 2017

First of all, Pearl Street Mall is just as lovely as I remember, but OMG it is so crowded, with so many new stores and chains. Still, good food, good views, hot weather, lovely walk.

Welcome to Day 2! http://neondataskills.org/data-institute-17/day2/
Our morning session focused on reproducibility and workflows with the great Naupaka Zimmerman. Remember the characteristics of reproducibility - organization, automation, documentation, and dissemination. We focused on organization, and spent an enjoyable hour sorting through an example messy directory of misc data files and code. The directory looked a bit like many of my directories. Lesson learned. We then moved to working with new data and git to reinforce yesterday's lessons. Git was super confusing to me 2 weeks ago, but now I think I love it. We also went back and forth between Jupyter and python stand alone scripts, and abstracted variables, and lo and behold I got my script to run. All the git stuff is from http://swcarpentry.github.io/git-novice/

The afternoon focused on Lidar (yay!) and prior to coding we talked about discrete and waveform data and collection, and the opentopography (http://www.opentopography.org/) project with Benjamin Gross. The opentopography talk was really interesting. They are not just a data distributor any more, they also provide a HPC framework (mostly TauDEM for now) on their servers at SDSC (http://www.sdsc.edu/). They are going to roll out a user-initiated HPC functionality soon, so stay tuned for their new "pluggable assets" program. This is well worth checking into. We also spent some time live coding with Python with Bridget Hass working with a CHM from the SERC site in California, and had a nerve-wracking code challenge to wrap up the day.

Fun additional take-home messages/resources:

Thanks to everyone today! Megan Jones (our fearless leader), Naupaka Zimmerman (Reproducibility), Tristan Goulden (Discrete Lidar), Keith Krause (Waveform Lidar), Benjamin Gross (OpenTopography), Bridget Hass (coding lidar products).

Day 1 Wrap Up
Day 2 Wrap Up 
Day 3 Wrap Up
Day 4 Wrap Up

Our home for the week

Our home for the week

Day 1 Wrap Up from the NEON Data Institute 2017

I left Boulder 20 years ago on a wing and a prayer with a PhD in hand, overwhelmed with bittersweet emotions. I was sad to leave such a beautiful city, nervous about what was to come, but excited to start something new in North Carolina. My future was uncertain, and as I took off from DIA that final time I basically had Tom Petty's Free Fallin' and Learning to Fly on repeat on my walkman. Now I am back, and summer in Boulder is just as breathtaking as I remember it: clear blue skies, the stunning flatirons making a play at outshining the snow-dusted Rockies behind them, and crisp fragrant mountain breezes acting as my Madeleine. I'm back to visit the National Ecological Observatory Network (NEON) headquarters and attend their 2017 Data Institute, and re-invest in my skillset for open reproducible workflows in remote sensing. 

Day 1 Wrap Up from the NEON Data Institute 2017
What a day! http://neondataskills.org/data-institute-17/day1/
Attendees (about 30) included graduate students, old dogs (new tricks!) like me, and research scientists interested in developing reproducible workflows into their work. We are a pretty even mix of ages and genders. The morning session focused on learning about the NEON program (http://www.neonscience.org/): its purpose, sites, sensors, data, and protocols. NEON, funded by NSF and managed by Battelle, was conceived in 2004 and will go online for a 30-year mission providing free and open data on the drivers of and responses to ecological change starting in Jan 2018. NEON data comes from IS (instrumented systems), OS (observation systems), and RS (remote sensing). We focused on the Airborne Observation Platform (AOP) which uses 2, soon to be 3 aircraft, each with a payload of a hyperspectral sensor (from JPL, 426, 5nm bands (380-2510 nm), 1 mRad IFOV, 1 m res at 1000m AGL) and lidar (Optech and soon to be Riegl, discrete and waveform) sensors and a RGB camera (PhaseOne D8900). These sensors produce co-registered raw data, are processed at NEON headquarters into various levels of data products. Flights are planned to cover each NEON site once, timed to capture 90% or higher peak greenness, which is pretty complicated when distance and weather are taken into account. Pilots and techs are on the road and in the air from March through October collecting these data. Data is processed at headquarters.

In the afternoon session, we got through a fairly immersive dunk into Jupyter notebooks for exploring hyperspectral imagery in HDF5 format. We did exploration, band stacking, widgets, and vegetation indices. We closed with a fast discussion about TGF (The Git Flow): the way to store, share, control versions of your data and code to ensure reproducibility. We forked, cloned, committed, pushed, and pulled. Not much more to write about, but the whole day was awesome!

Fun additional take-home messages:

Thanks to everyone today, including: Megan Jones (Main leader), Nathan Leisso (AOP), Bill Gallery (RGB camera), Ted Haberman (HDF5 format), David Hulslander (AOP), Claire Lunch (Data), Cove Sturtevant (Towers), Tristan Goulden (Hyperspectral), Bridget Hass (HDF5), Paul Gader, Naupaka Zimmerman (GitHub flow).

Day 1 Wrap Up
Day 2 Wrap Up 
Day 3 Wrap Up
Day 4 Wrap Up

DS421 Data Science for the 21st Century Program Wrap Up!

Today we had our 1st Data Science for the 21st Century Program Conference. Some cool things that I learned: 

  • Cathryn Carson updated us on the status of the Data Science program on campus - we are teaching 1200 freshman data science right now. Amazing. And a new Dean is coming. 
  • Phil Stark on the danger of being at the bleeding edge of computation - if you put all your computational power into your model, you have nothing left to evaluate uncertainty in your model. Let science guide data science. 
  • David Ackerly believes in social networking! 
  • Cheryl Schwab gave us an summary of her evaluation work. The program outcomes that we are looking for in the program are: Concepts, communication, interdisciplinary research
  • Trevor Houser from the Rhodian Group http://rhg.com/people/trevor-houser gave a very interesting and slightly optimistic view of climate change. 
  • Break out groups, led by faculty: 
    • (Boettiger) Data Science Grand Challenges: inference vs prediction; dealing with assumptions; quantifying uncertainty; reproducibility, communication, and collaboration; keeping science in data science; and keeping scientists in data science. 
    • (Hsiang) Civilization collapses through history: 
    • (Ackerly) Discussion on climate change and land use. 50% of the earth are either crops or rangelands; and there is a fundamental tradeoff between land for food and wildlands. How do we deal with the externalities of our love of open space (e.g. forcing housing into the central valley). 
  • Finally, we wrapped up with presentations from our wonderful 1st cohort of DS421 students and their mini-graduation ceremony. 
  • Plus WHAT A GREAT DAY! Berkeley was splendid today in the sun. 
 

Plus plus, Carl B shared Drew Conway's DS fig, which I understand is making the DS rounds: 

From: http://drewconway.com/zia/2013/3/26/the-data-science-venn-diagram

From: http://drewconway.com/zia/2013/3/26/the-data-science-venn-diagram

Women in GIS interview!

Hi all! I was recently profiled for the excellent website: Women in GIS (or WiGIS). This is a group of technical-minded women who maintain this website to feature women working in the geospatial industry with our Who We Are spotlight series. and in addition, the individuals in this group make their presence known at conferences like CalGIS and ESRI’s UCs. We also plan to host a number of online resources women might find useful to start or navigate their GIS career.

Excellent time, and thanks for the opportunity!

Great links from class today

Today was WebGIS and the Geoweb (I know, we could do a whole semester), and rounded up some nice resources. 

  1. Open Street Map interactions (from Vanessa):
    1. Here is Overpass Turbo, the OSM data filtering site. https://overpass-turbo.eu
    2. Here is Tag Info, where you can find the keys to query information on Overpass Turbo. https://taginfo.openstreetmap.org/
  2. Privacy (from Wyeth): Radiolab did a great piece on the intersection between GIS data and privacy.
    1. Link to the article: http://www.radiolab.org/story/update-eye-sky/ (this is the updated article after changes from the original broadcast in June 2015 [http://www.radiolab.org/story/eye-sky/] ) 
    2. Also, the company that developed from this: http://www.pss-1.com/

Spatial Data Science Bootcamp 2016!

Last week we held another bootcamp on Spatial Data Science. We had three packed days learning about the concepts, tools and workflow associated with spatial databases, analysis and visualizations. Our goal was not to teach a specific suite of tools but rather to teach participants how to develop and refine repeatable and testable workflows for spatial data using common standard programming practices.

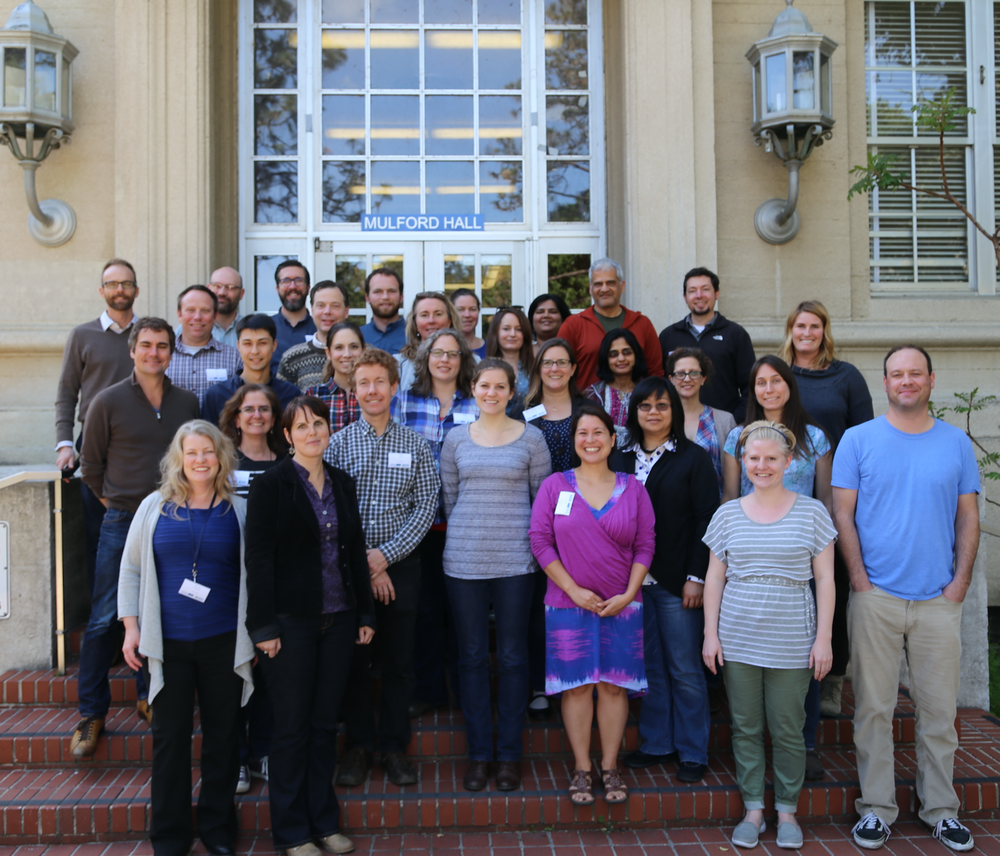
2016 Bootcamp participants

On Day 1 we focused on setting up a collaborative virtual data environment through virtual machines, spatial databases (PostgreSQL/PostGIS) with multi-user editing and versioning (GeoGig). We also talked about open data and open standards, and moderndata formats and tools (GeoJSON, GDAL).  On Day 2 we focused on open analytical tools for spatial data. We focused on Python (i.e. PySAL, NumPy, PyCharm, iPython Notebook), and R tools.  Day 3 was dedicated to the web stack, and visualization via ESRI Online, CartoDB, and Leaflet. Web mapping is great, and as OpenGeo.org says: “Internet maps appear magical: portals into infinitely large, infinitely deep pools of data. But they aren't magical, they are built of a few standard pieces of technology, and the pieces can be re-arranged and sourced from different places.…Anyone can build an internet map."

All-in-all it was a great time spent with a collection of very interesting mapping professionals from around the country. Thanks to everyone!

IGIS exploring applications of drones for UC Agriculture and Natural Resources

IGIS is excited to be working with 3D Robotics (3DR) to explore new applications of small unmanned aerial systems (sUAS) for monitoring agriculture and natural resources.  This technology has never been more practical for scientific exploration; however, there is still much to be learned about how to best utilize sUAS in this way.

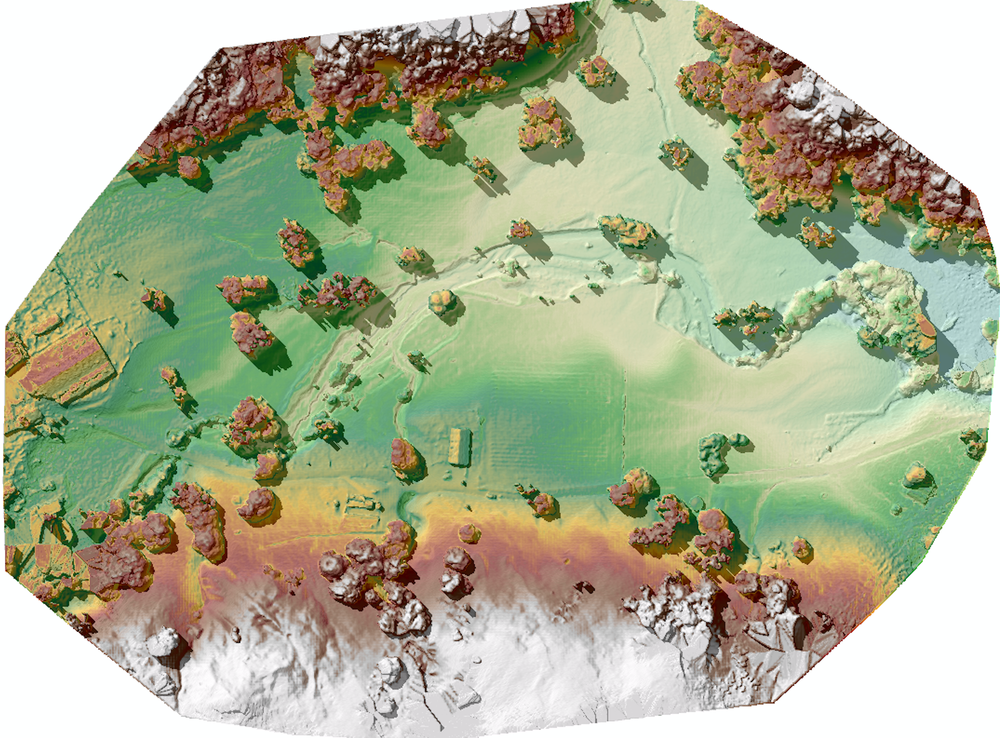
DEM from drone flightIGIS is now developing protocols for safe and efficient deployment of a 3DR Solo sUAS.  Equipped with a common 12 megapixel GoPro Hero camera, this platform can survey up to 75 acres, at 3 inches of spatial resolution in less than 20 minutes, while flying a pre-defined flight path at 23 miles per hour, at 300 feet above ground level.  Then thanks to Pix4D mapping software, which is used to combine the pictures collected by the sUAS's GoPro into a single image mosaic, automated photogrammetric processes can render a digital terrain model from the images with a vertical accuracy close to the same 3 inches spatial resolution found in the original image collection.

IGIS has introduced sUAS and remote sensing training into our workshop schedule for this year.  Please check out our IGIS training calendar by Clicking Here for more information.

ESRI @ GIF Open GeoDev Hacker Lab

We had a great day today exploring ESRI open tools in the GIF. ESRI is interested in incorporating more open tools into the GIS workflow. According to www.esri.com/software/open, this means working with:

  1. Open Standards: OGC, etc.

  2. Open Data formats: supporting open data standards, geojson, etc.

  3. Open Systems: open APIs, etc.

We had a full class of 30 participants, and two great ESRI instructors (leaders? evangelists?) John Garvois and Allan Laframboise, and we worked through a range of great online mapping (data, design, analysis, and 3D) examples in the morning, and focused on using ESRI Leaflet API in the afternoon. Here are some of the key resources out there.

Great Stuff! Thanks Allan and John

Hold the date! January 15th for a workshop on Open Tools with ESRI

On January 15th we will hold a full day free workshop on Open Mapping Tools using ESRI. 

Welcome to the Esri GeoDev HackerLab. This is an eight-hour, mentored, hands-on lab for developers (novice or experienced) where you will learn how to build maps and apps for the web, devices, and desktops using ArcGIS and other technologies. 

Here is what we will cover:

1. A brief intro to ArcGIS Online for developers. Get the free dev subscription and we put the tools right into your hands.

2. Data: Search, find, connect to, import, edit, collect, translate, convert, and host datasets and web services. You will also use a variety of cloud-based geoanalytical tools to make better sense of the data and export new datasets for your apps to use.

3. Design: Create web maps tailored to the needs of your end users using layer selection, thematic rendering, popups, and more.

4. Develop: Build customized apps with or without code, using templates, builders, APIs, and SDKs, from Esri and from other popular open source technologies.

The labs are divided into modules that you can do in any order. Choose ones you want to learn, and skip those you already know. You can bring your own data or use tutorial data that we provide. Use web maps of your own or build ones on-site during the lab. If you are a coder, dig into APIs and SDKs from Esri or compatible open source libraries. If you aren’t a coder, you can still build highly customized production-ready apps using templates and builders.

The tutorials are going to be led by developers from Esri, who will either guide you along the way or assist you as you choose your own learning path. 

Stay tuned for sign-up information!

California Economic Summit wrap-up

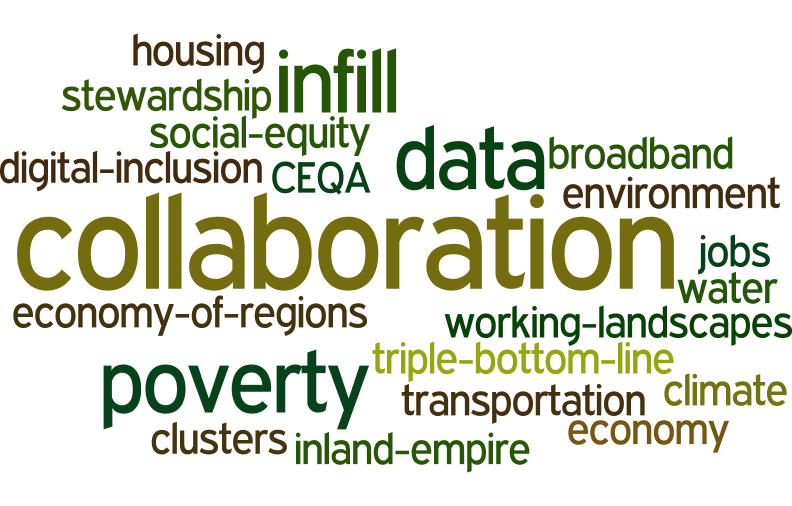
my wordle cloud on topics commonly discussed at the summit

I spent two days at the California Economic Summit, held this year in Ontario, heart of the "inland empire". I learned much about this region of the state that I know mostly as freeways connecting water polo games, or as endless similar roads through malls and housing developments. It is more populous, diverse, and vibrant than I had realized. The conference itself was very different from any that I have been to. Hardly any presentations, but break-out groups, passionate, inspiring panelists, tons of networking, good overviews, multiple perspectives, and no partisanship.

Here are some interesting facts about California that I did not know: 

  • 80% of CEQA lawsuits are related to urban infill development. Shocking. We need infill development as a sensible solution to a growing California. 
  • 1 in 3 children in the Central Valley live in poverty. 1 in 4 kids live in poverty in the inland empire. These rates are WORSE than they have been ever. 
  • The Bay Area is an anomaly in terms of education, income, health, voting rates, broadband adoption. The Bay Area is not representative of the state!
  • Think of a west-east line drawn across the state to demark the population halfway line. Where might it be? No surprise it is moving south. Now it runs almost along Wilshire Blvd in LA!
  • Empowering the Latino community in the state is going to be key in continued success. 
  • Broadband adoption around the state is highly variable: Latino, poor and disabled communities are far below other communities in terms of adoption. 
  • The first beer made with recyled water has been made by Maverick's Brewing Company. 
  • Dragon Fruit might be the new water-wise avocado. Good anti-oxidents, massive vitamin C, good fiber, etc. They taste a bit like a less sweet kiwi, with a bit of texture from the seeds. I don't think I'd like the quac, however. 
  • In 15 years, the state will be in a deficit of college graduates needed to meet skilled jobs. Those 2030 graduates are in 1st grade now, so we can do some planning. 
  • Access, affordability, and attainability are the cornerstones of our great UC system. 

In every session I attended I heard about the need for, and lack of collaboration between agencies, entities, people, in order to make our future better. Here is my wordle cloud of discussion topics, from my biased perspective, or course. 

Honorary Geographer Maya Lin

When entertaining out of town visitors in the Bay Area you have a bounty of choices. Many years ago I took visitors to SFMOMA and stumbled into a Maya Lin exhibit. It blew my mind, and I've been a fan ever since. (I've even invited her to give a geolunch talk, but alas it has not happened.) At that time, I had no idea she was the the designer of the Vietnam Veterans Memorial in Washington, D.C., which I found to be a sublime work of reverance. She makes art with strong clear forms that echo the earth. I think what she does resonates with me so much because the idea of spatial representation of geographic form is for me the heart of all we do in science, yet it allows for deep and immediate understanding of place. Whenever I see one of her pieces, I "get" it very quickly, and always feel a little bit happier. Art, what can you say. 

Maya Lin: SF Bay @ Brower CenterShe had a small installation recently in the Brower Center in Berkeley. It was lovely. I can't find it on her website, so you will have to trust this. I include one picture here at left.  It is a representation of the Bay, made in some kind of metal, mounted flush on the wall.  In the same show she had a model of the Sacramento River made from silver stick pins, also mounted on the wall - very fluid and playful with light. I use a slide of her model of the SF Bay shown here as an into into my lectures on modeling (also a shot of the weird and wonderful SF Bay model in Sausalito, more about that anon). 
Her most recent work at the Smithsonian's newly renovated Renwick Gallery uses green marbles to model the Chesapeake Bay. It is a stunning piece, I wish I could be there. I read about the work here.  
Maya Lin: Chesapeake Bay, Smithsonian
Her description of a recent (2008) installation at the California Academy of Sciences in SF "Where the Land Meets the Sea" says: "By using science and technology in her artwork to create new ways of looking at the environment, Maya Lin's work inspires viewers to pay closer attention to the natural world." I think that is true, but it is also true that it is pleasing because it is so apart from the natural world and yet so resonant with it. If that makes any sense. The work is below:
Maya Lin's Where the Land Meets the Sea at Cal Academy in 2008
In that piece (picture above) modeling the shape of the SF Bay, the terrain (or bathymetry) is based on data supplied by the U.S. Geological Survey, among others, and represents a 1:700 scale with a vertical exaggeration of 5 times above sea level and 10 times below. Sea level is 18 feet above the terrace.
Looking forward to seeing more of her work, in person if possible. 


GIS-related courses for Spring 2016

Hello World!

There are several GIS classes to chose from in the spring. So far we have: 

Lower division:

  • ESPM 72 Geographic Information Systems *Not sure who is teaching this yet*

Upper division:

  • Biging, G & Radke, J ESPM 177 GIS and Environmental Spatial Data Analysis
  • Chambers, J    GEOG 185    Earth System Remote Sensing   
  • O'Sullivan, D   GEOG 187 Geographic Information Analysis

Graduate:

  • Radke, J    LDARC 221    Quantitative Methods in Environmental Planning
  • Dronova, I LDARC 221 Applied Remote Sensing
  • Chambers, J GEOG 285 Topics in Earth System Remote Sensing
  • Wang, I   ESPM 290 Special Topics in Environmental Science: Spatial Ecology

Email me with others. 
Thanks!